Biomass For All: Designing An Inclusive Biomass Infrastructure

In Flanders, energy and materials transition increasingly appear on the political agenda. Pilot installations recovering heat from deep geothermal subsurface layers, windmills, solar panels, neighborhood or industry park heat networks, and short chain biomass landscape waste valorization increasingly make their appearance in the Flemish energy landscape. Besides new technologies enabling sustainable energy production, alternative governance models such as energy co-ops and crowdfunding enable citizens to participate in energy transition [1]. As a result, public private partnerships realize large scale offshore wind farms, while civil society simultaneously initiates more localized energy co-ops. This diversification in energy infrastructure inevitable brings the question of power to the table. Who owns the infrastructure and who benefits from the produced energy?

Indeed, as with any new infrastructure, the question of power is central. Architect Stephen Graham and geographer Simon Marvin have argued that privatization politics behind infrastructure development often results in ‘Splintering Urbanism’ or mechanisms of exclusion [2]. Critical urban geographers such as Matthew Gandy highlight how “uneven distribution of natural resources and environmental hazards” are the result of “negotiations between political actors, ideological struggles, and power relations” [3].

Acknowledging the key role of politics behind infrastructure engineering and design, Greet De Block calls for urban and landscape designers to be more explicit about this political dimension in their designs [4]. Landscape architect Kate Orff even takes this a step furthers stating that “The answer isn’t just for designers to be political, but to design in a political context” [5].

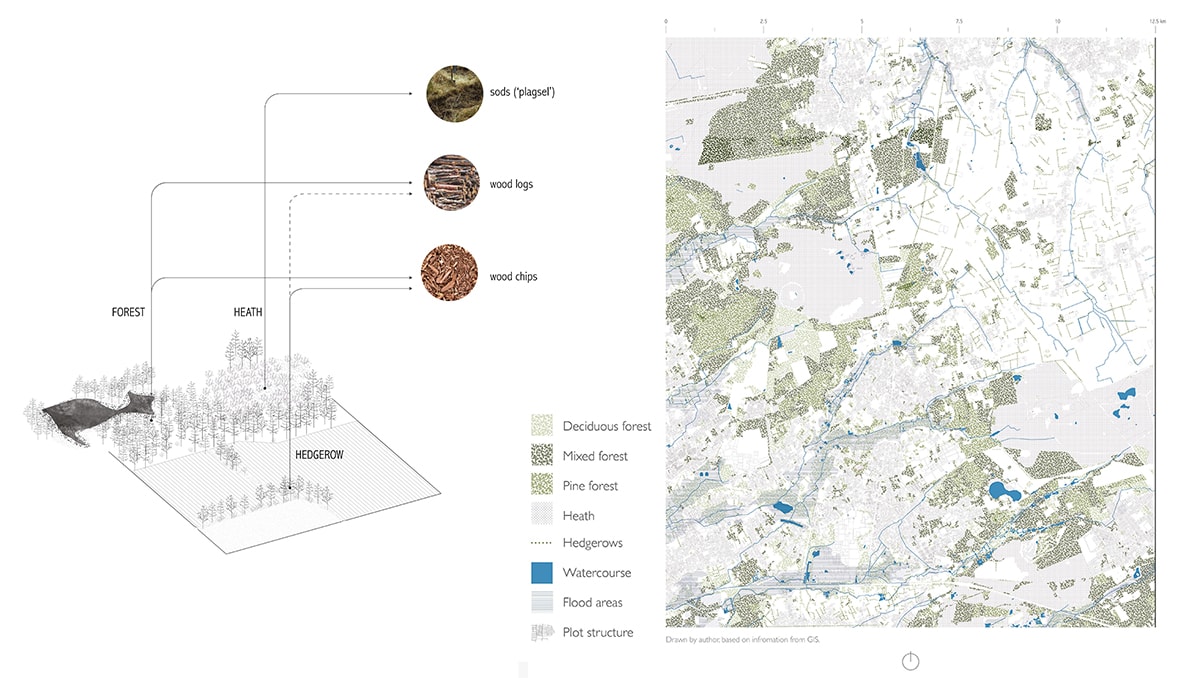
Figure 1. Houthalen-Helchteren’s (HH) four main landscape types: mixed woodlands, forested wetlands, managed hedgerows, and heath, along with the biomass types that can be harvested from this landscape.


While critical theorists and historians are bringing discussions of power front and center in the energy conversation, design studies on Flemish energy landscapes tend to concentrate on spatial implications of new technologies [6]. They mainly focus on the quantification questions and the engineering challenge of 100% carbon neutrality by 2050. This initial focus on technology however does not imply that designers automatically overlook energy transition’s political dimensions. Adopting design research for a new biomass infrastructure in Limburg, this article unpacks how questions of power are foundational to urban design proposals for new (energy) infrastructures. The presented design unfolds how existing government plans and projects for a biomass infrastructure in Central Limburg could find synergies with seemingly unrelated site-specific challenges and opportunities, incorporating social and environmental agendas.


Landscape management waste as a resource

Limburg is one of Flanders’ greenest provinces consisting of four main landscape types: mixed woodlands, forested wetlands, managed hedgerows, and heath (Figure 1). Each of these landscape types follows specific growth and maintenance cycles, requiring specific equipment (Figure 2). Limburg’s Low Campine Regional Landscape Agency (RLLK), operationalizing the mission to reinforce the regional cultural landscape and nature, initiated the biomass square concept in the municipality of Houthalen-Helchteren (HH). With the biomass square initiative, RLLK aims to valorize landscape management waste as a resource, respecting natural cycles and supporting local stakeholders. Biomass square is a new step in collective landscape maintenance in which the land stewards share equipment and differentiate their income streams [7]. Biomass square gathers and sorts waste biomass over a 20km radius, to guarantee a CO2 neutral operation. In the square, the biomass is sorted, packaged, and redistributed as raw material for manufacturing use, such as construction materials, animal feed and, when no higher energetic value application is possible, for energy production through bio-digestion, producing heat or electricity.

Figure 2. Each landscape type has its own growth and maintenance cycle. Top: The cultural heath landscape maintenance cycle, and what happens when you stop maintaining it, bottom: the required phasing in the harvesting of biomass from hedgerows preserving a rich biodiversity.


Recovering previously untouched biomass from landscape management at a regional scale initiates new regional material flows, requiring new logistical operations. In other words, it requires a new infrastructural system (Figure 3).

RLLK’s new biomass infrastructure consists of physical components (such as places for storage, pick-up, packaging and redistribution, and is supported by DIPLA (‘Digital platform landscape’), a state-of-the-art digital planning tool. This efficient maintenance planning tool makes it possible to map and calculate exact real-time biomass volumes from landscape maintenance in an area. DIPLA enables RLLK to integrate landscape management waste valorization within their larger mission of landscape restoration and regeneration. For participating municipalities and stakeholders, the application provides a base that can improve the quality and efficiency of the harvesting process and calculate the cost and benefits of their harvesting activities [8].

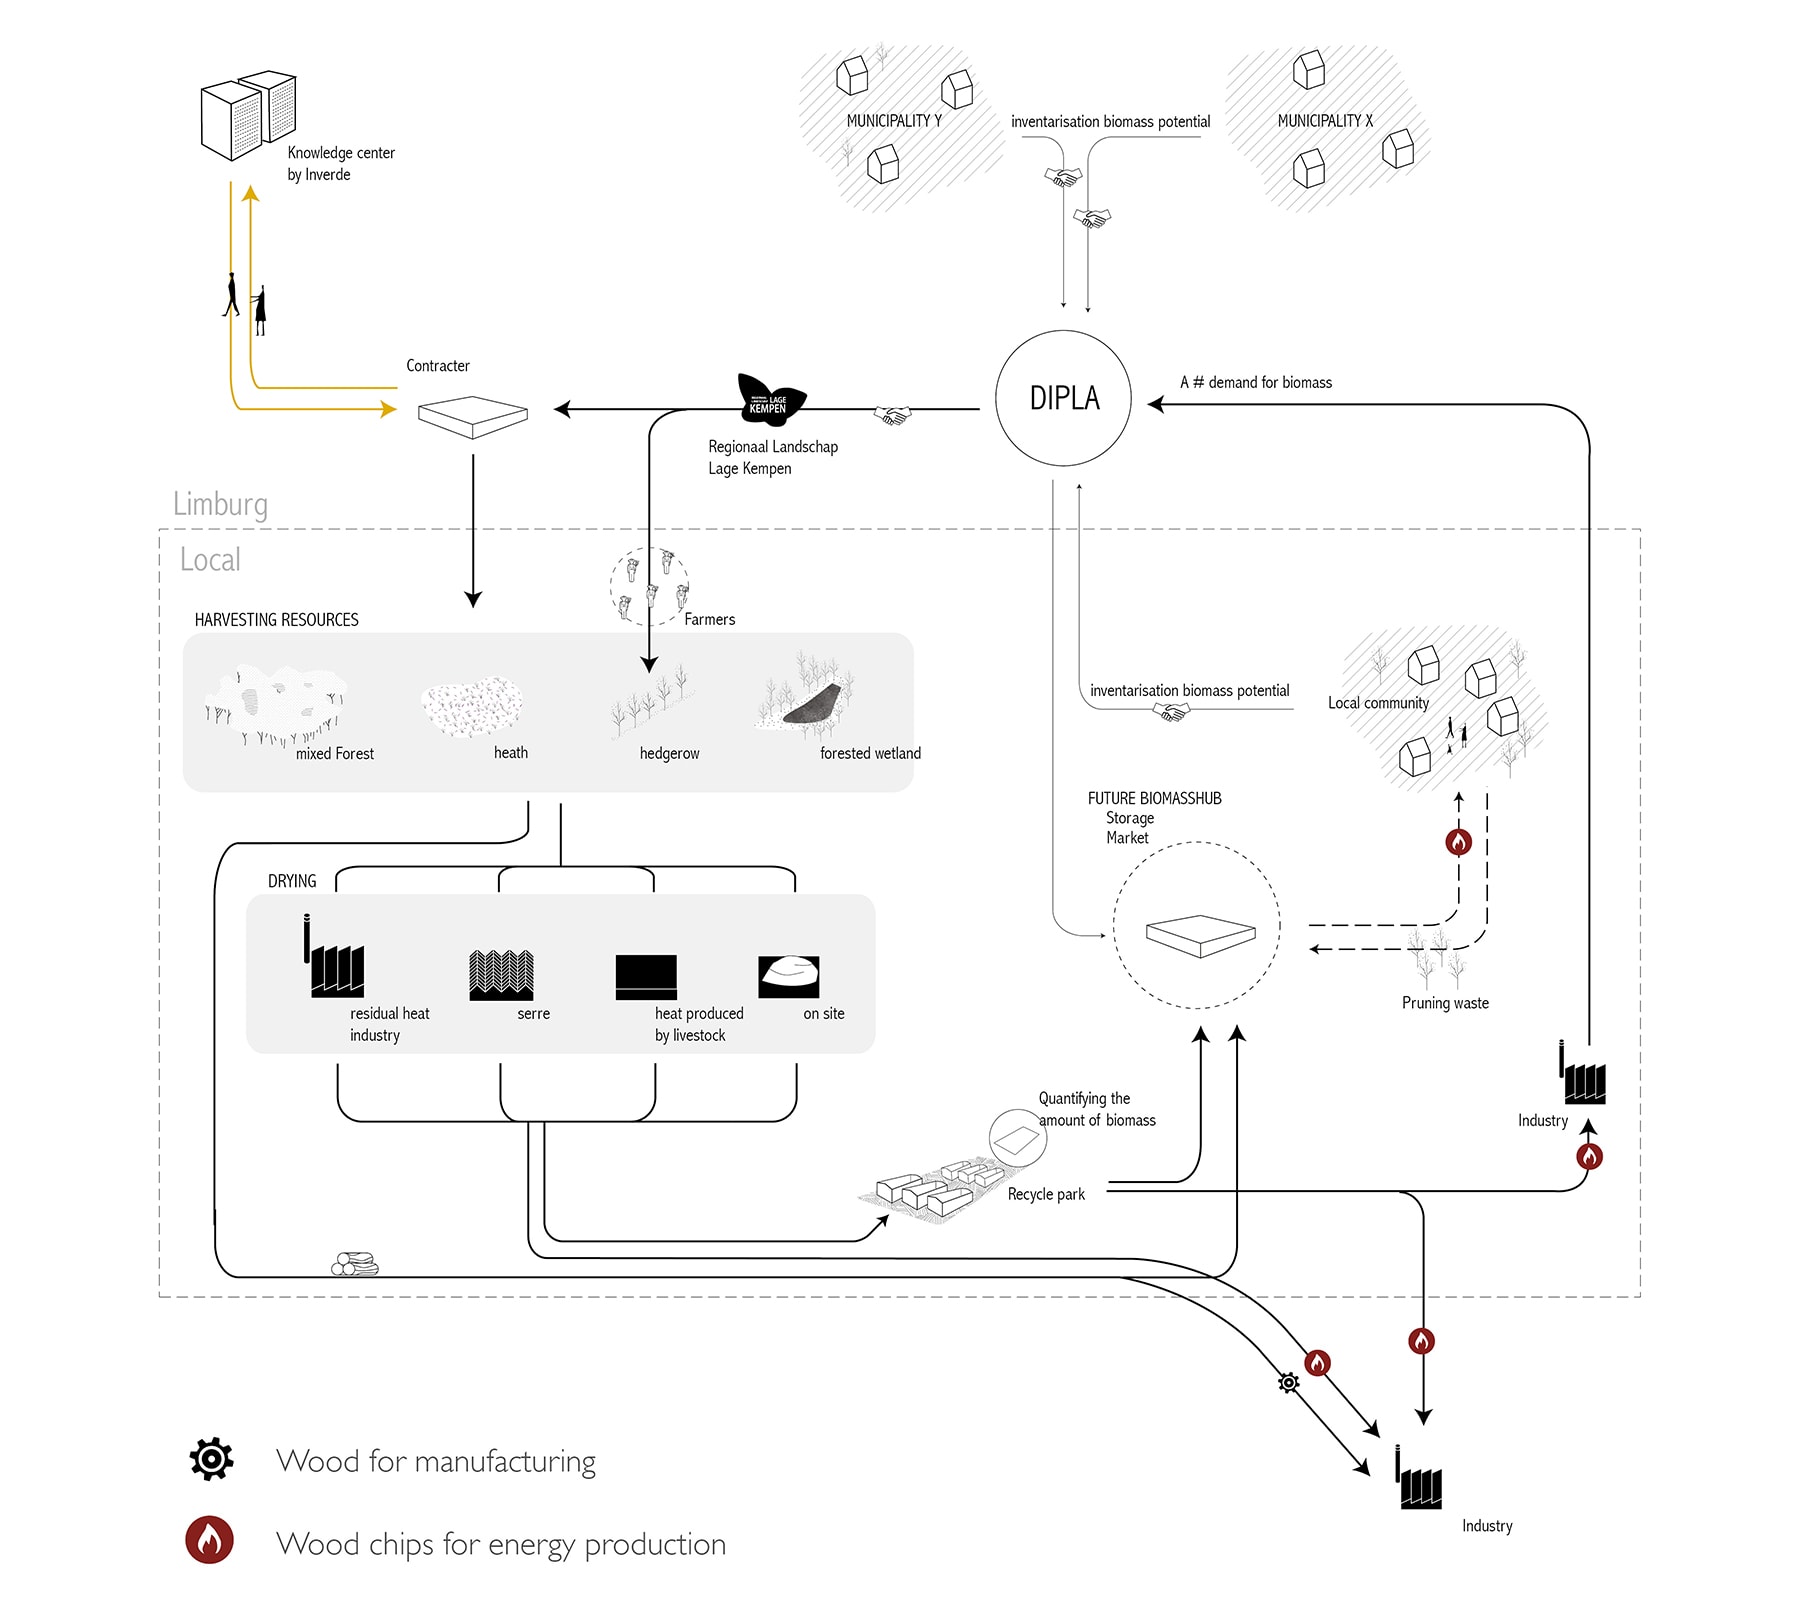
Figure 3. The new biomass chain incorporating biomass recovery through harvesting, drying, weighing and selling it as raw material.


Collective landscape economies

As discussed in the previous section, the plans of the RLLK to valorize landscape management waste as biomass are highly contextualized while incorporating innovative solutions such as the DIPLA digital application. On one hand, the biomass collection follows natural landscape cycles and contributes to RLLK’s core mission to restore and regenerate threatened landscape ecologies. On the other hand, it empowers landowners to form new collective arrangements in maintaining their land through common maintenance strategies and new revenue [9]. This new collective arrangement valorizing natural resource flows recalls pre-industrial times when landscape maintenance in Central Limburg intensely intertwined social, economic and environmental dimensions.

Central Limburg comprised poor heath-covered sandy soils on the plateau, and fertile plateau edges and valleys. For military reasons, this inhospitable landscape was maintained as a buffer for future invasion by the Dutch [10]. Being largely isolated, the people of the Campine created their own ecosystems, commonly using the land and its resources. They sent their sheep out to pasture in the heath during the day. At night the sheep were gathered in stables where their manure enriched turf and sod collected from the heath. The farmers then used this fertilizer to make the surrounding common wasteland productive, plot by plot. Additionally, the farmers sold honey produced by bees on the heath, as well as clothes and ropes made from the sheep’s wool and hemp [11] (Figure 4).

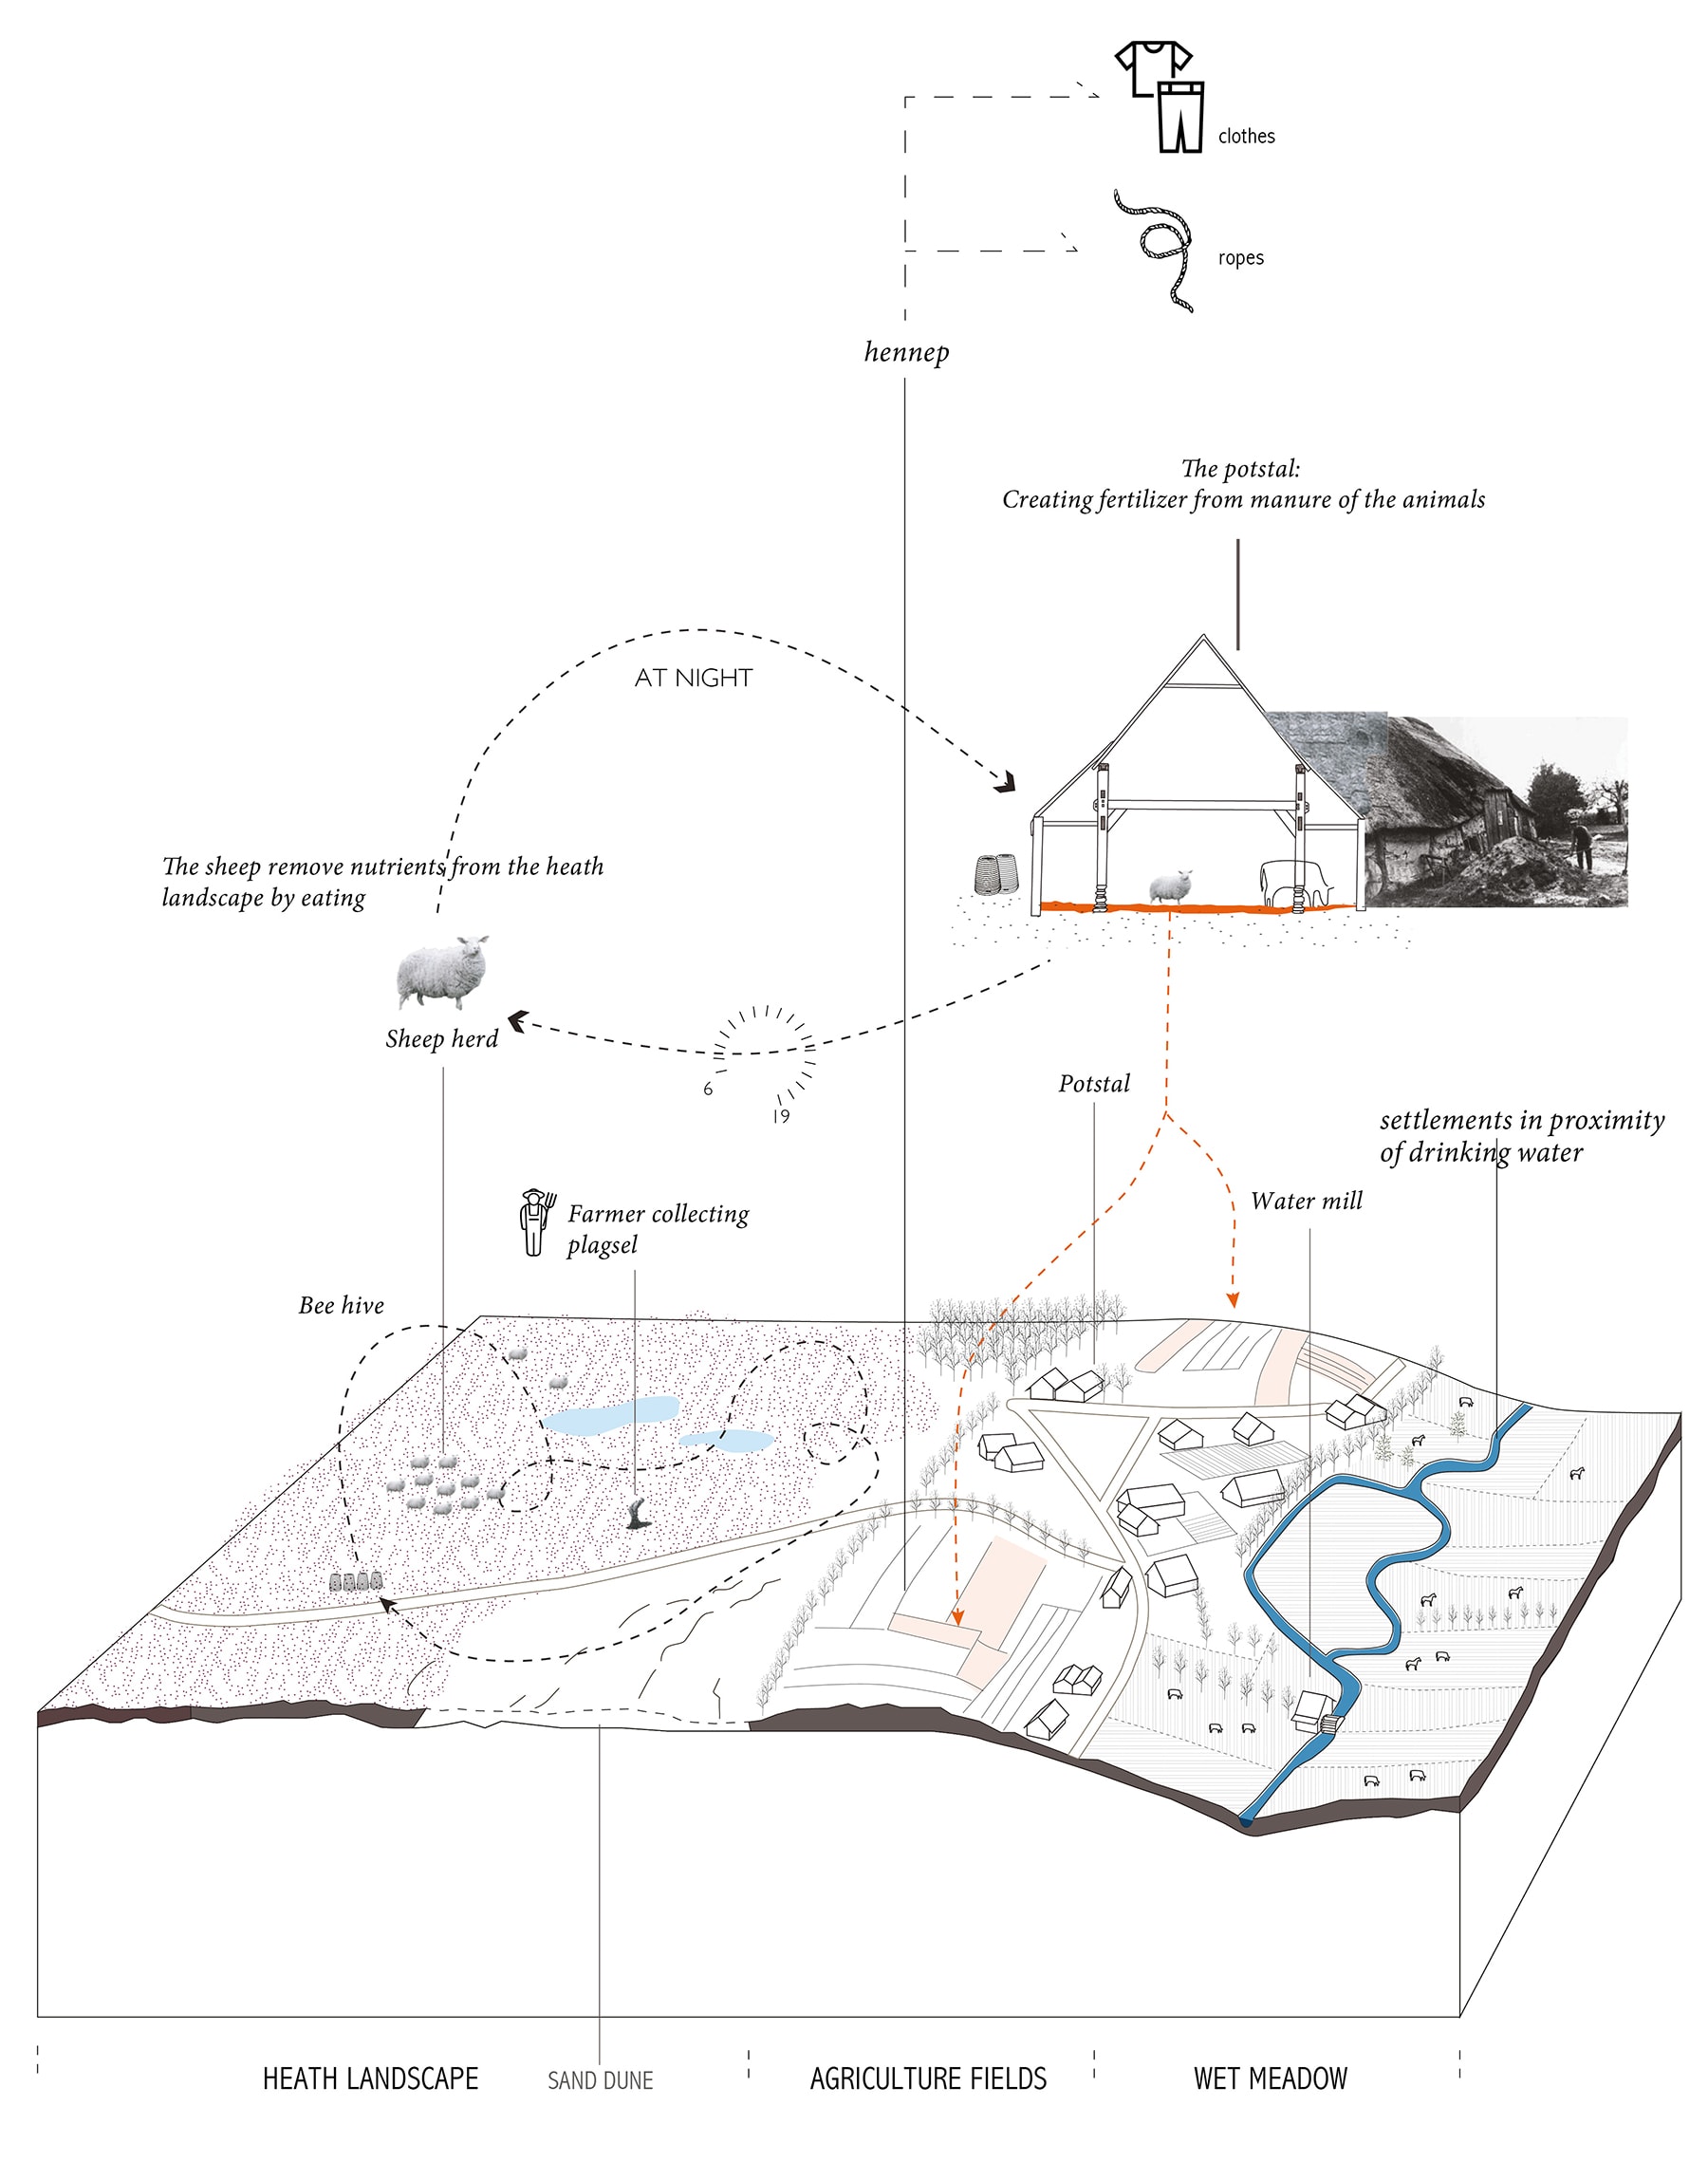
Figure 4. The pre-industrial man-nature ecosystem in Limburg’s poor heath landscape and rich valley meadows.


Gradually these rather balanced and productive interplays between people and the landscape dissolved with increasing colonization of Limburg’s natural resources, such as the extraction of coal in the beginning of the 20th century [12]. This led to a privatization of the common heath landscape for different means. The privatization together with the invention of artificial fertilizer in the 18th century, ushered the beginning of the end for the vast heath landscapes and its rich ecology. Decades of manipulating the soil with artificial fertilizer, industrialization of agriculture and the resulting changing vegetation has been devastating for the region’s biodiversity (Figure 5 – 6).

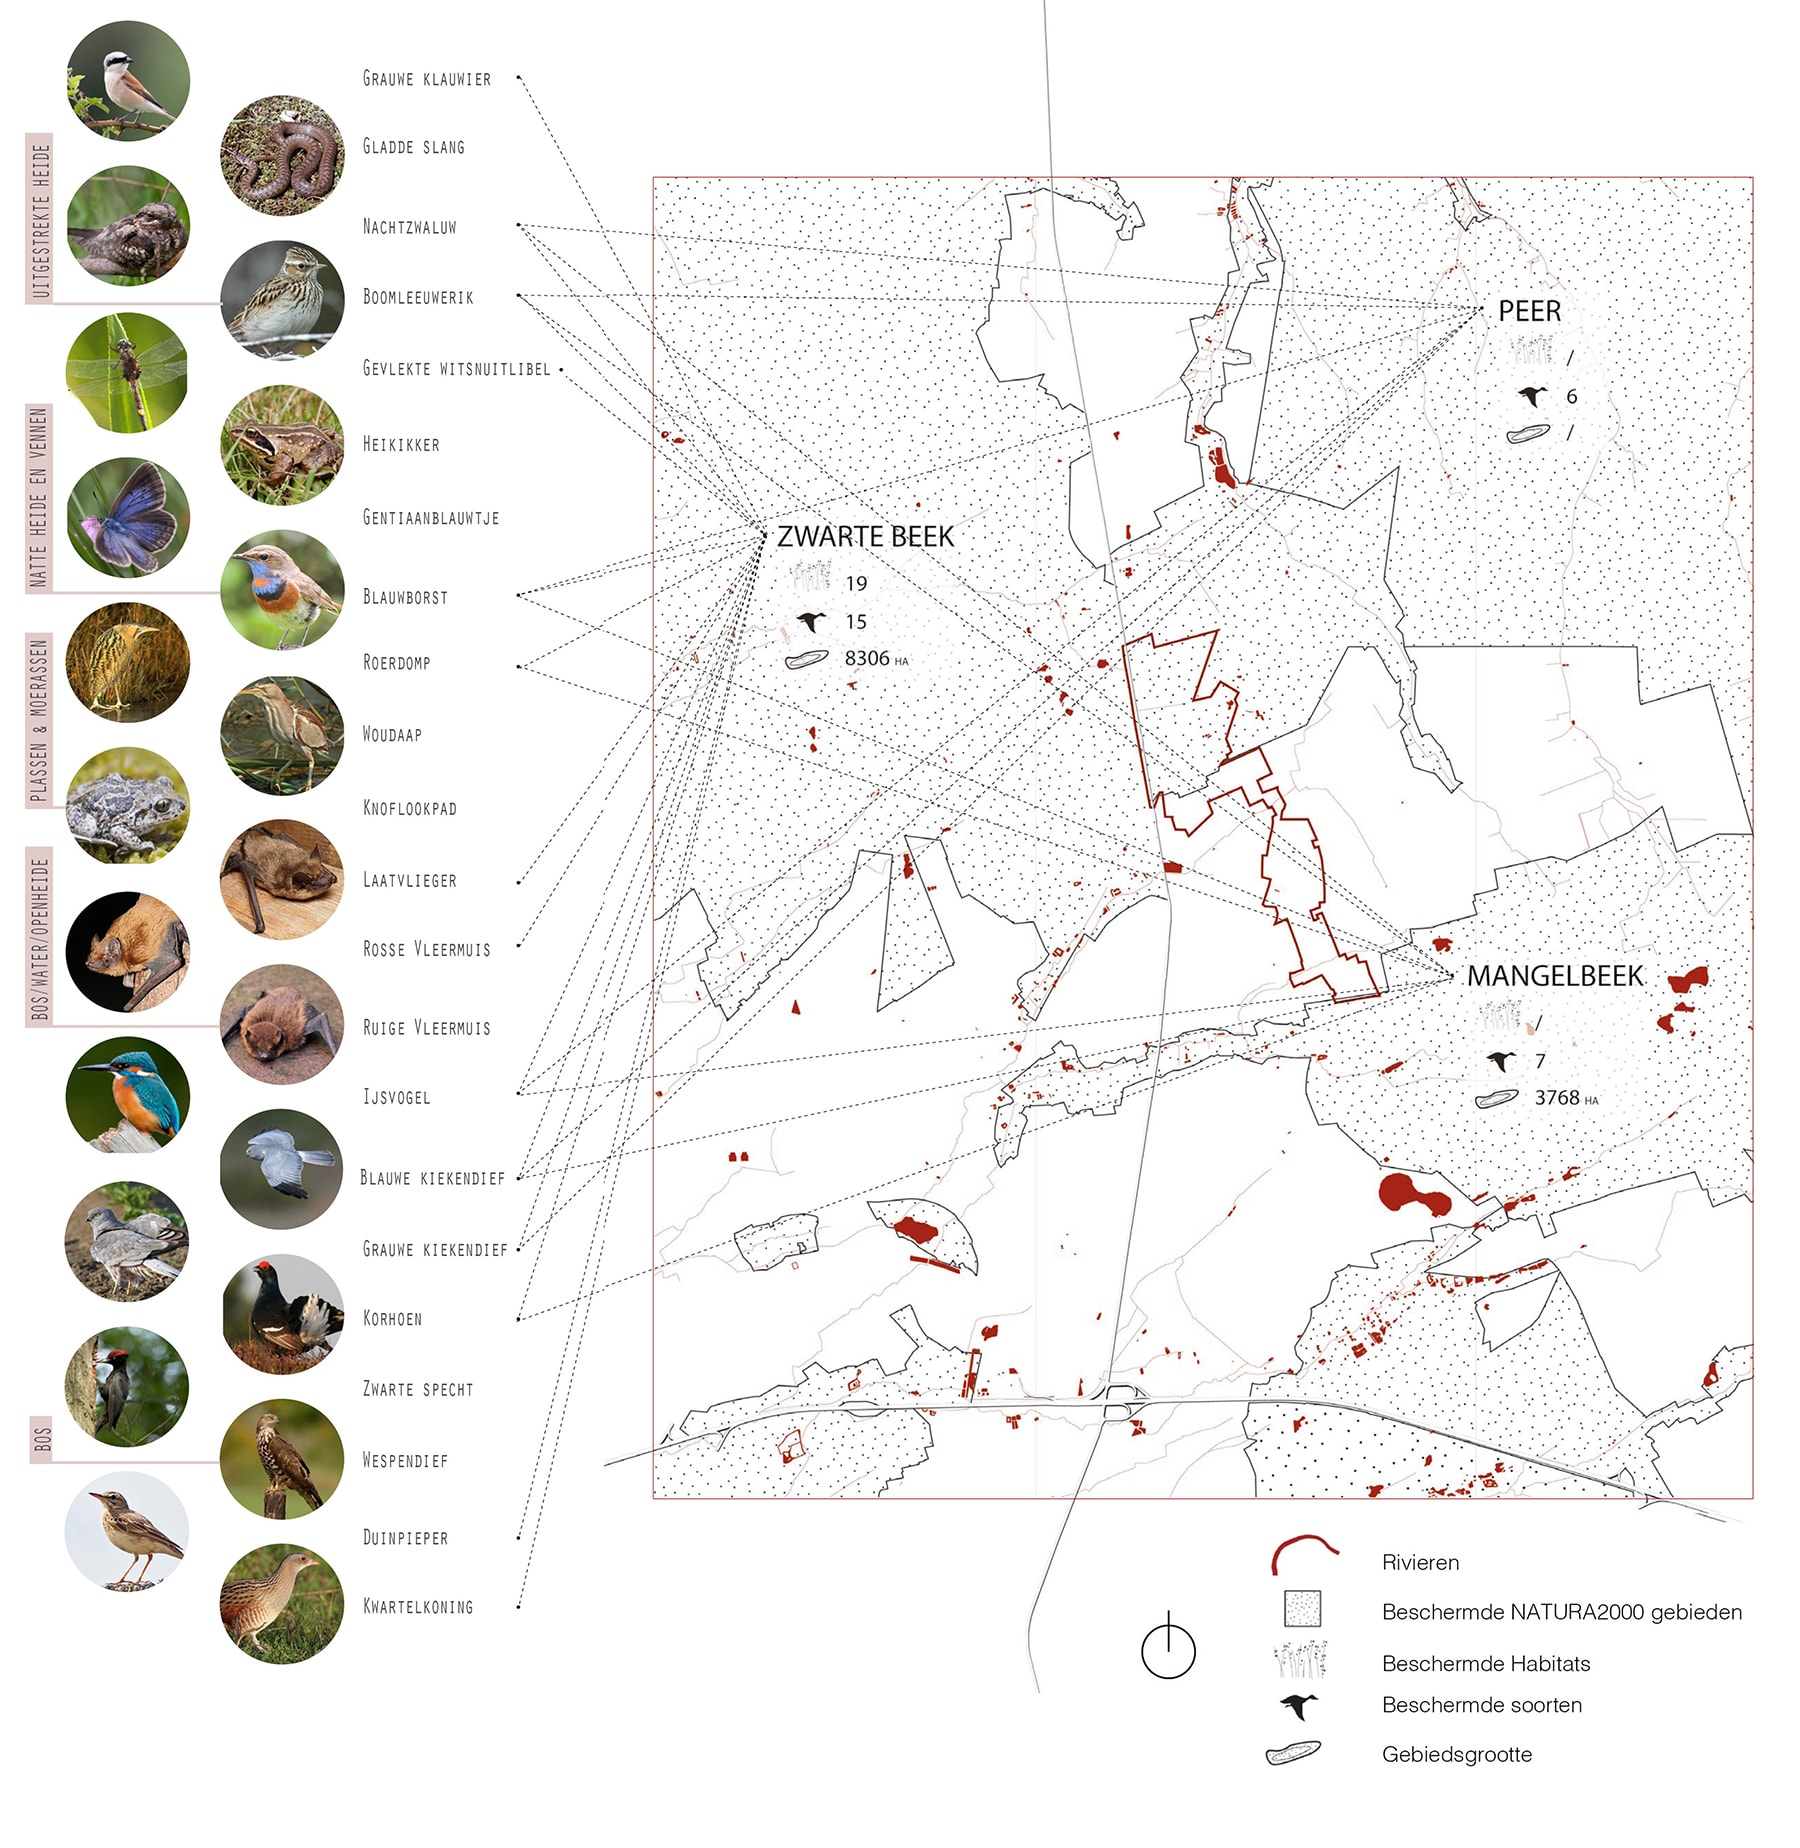
Figure 5. In order to protect and improve Europe’s rich nature conditions, different areas were delimitated in 2006. The map shows these area’s in the region of the design in relation to its rich and endangered biodiversity. The area marked in red is the ecological corridor as demarcated by the Flemish Government.


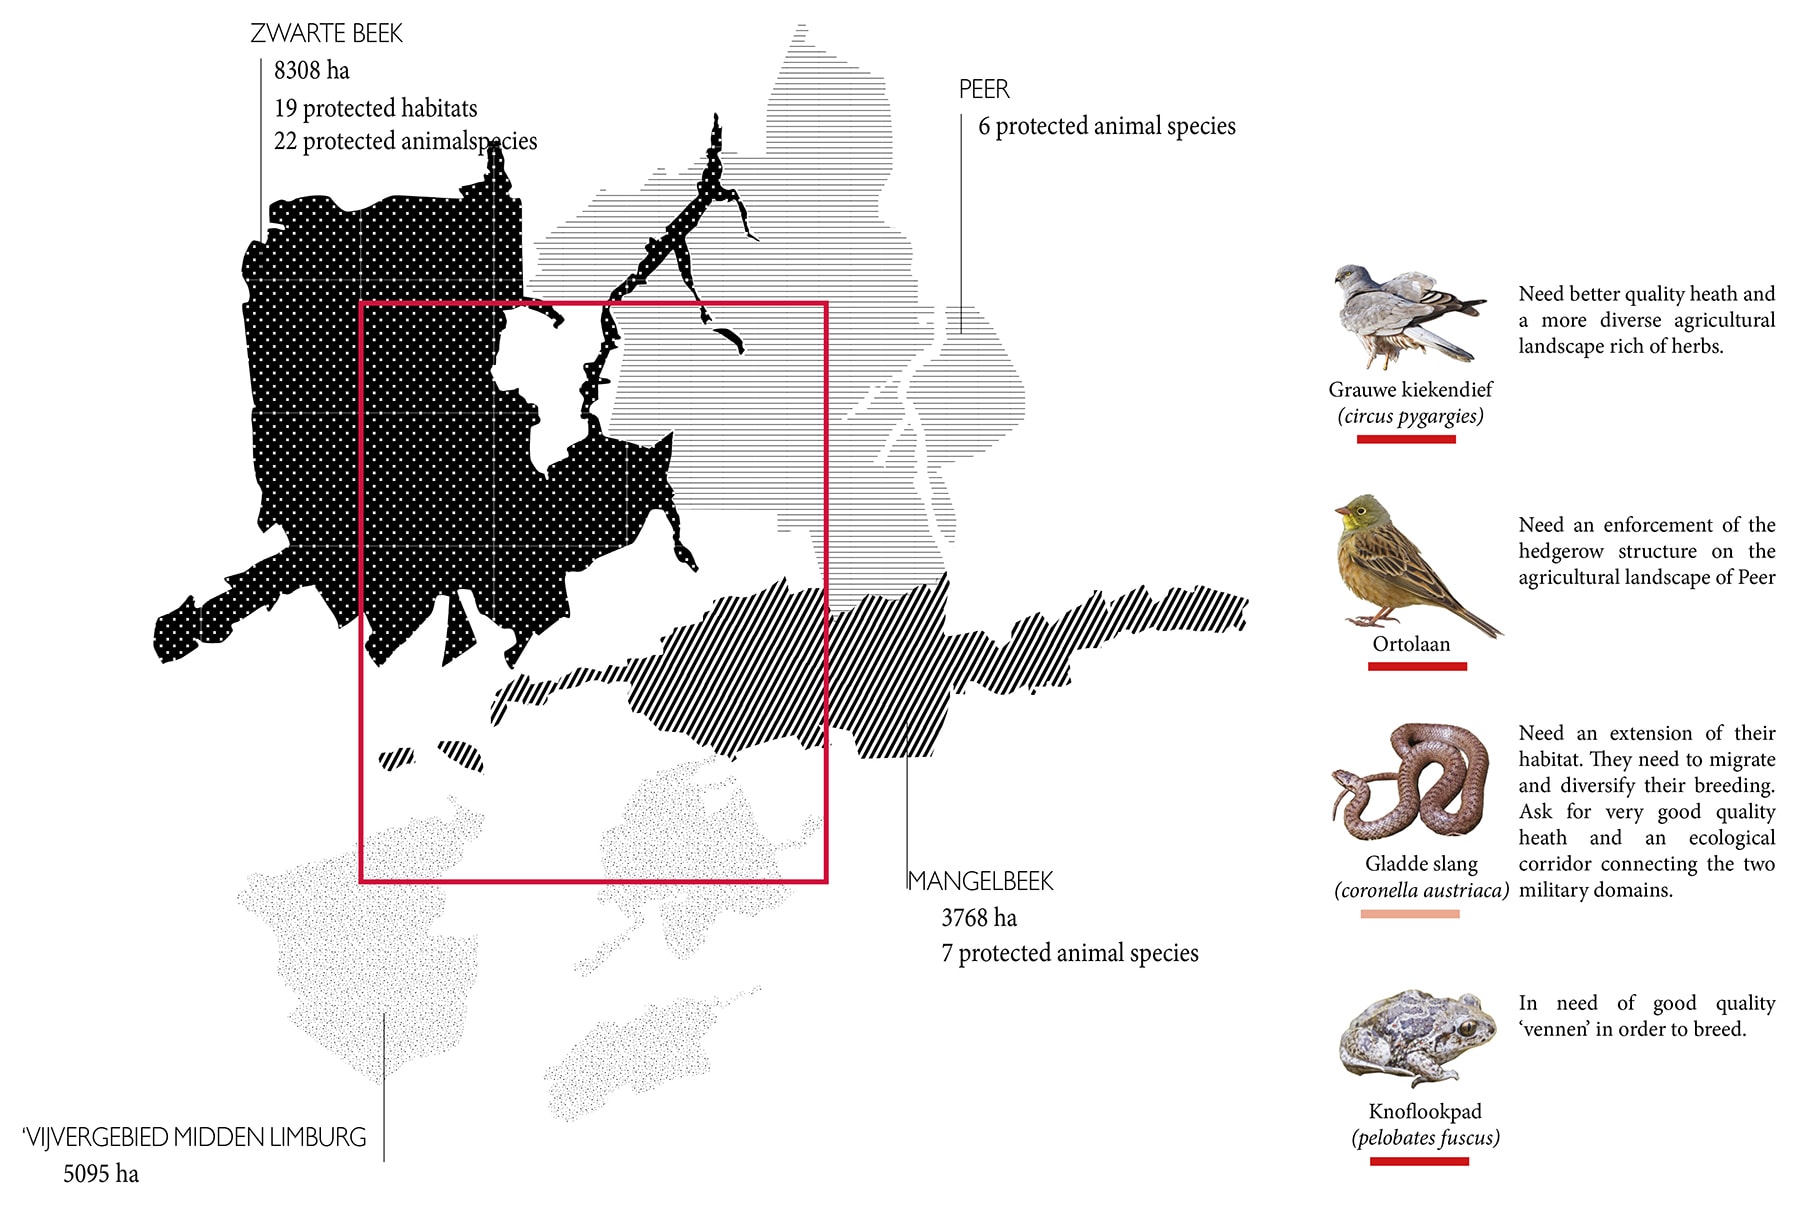
Figure 6. Showing the most endangered species in the region. All four species are currently on the verge of extinction, due to disappearance of their natural habitats.


Designing a socio-ecological biomass infrastructure

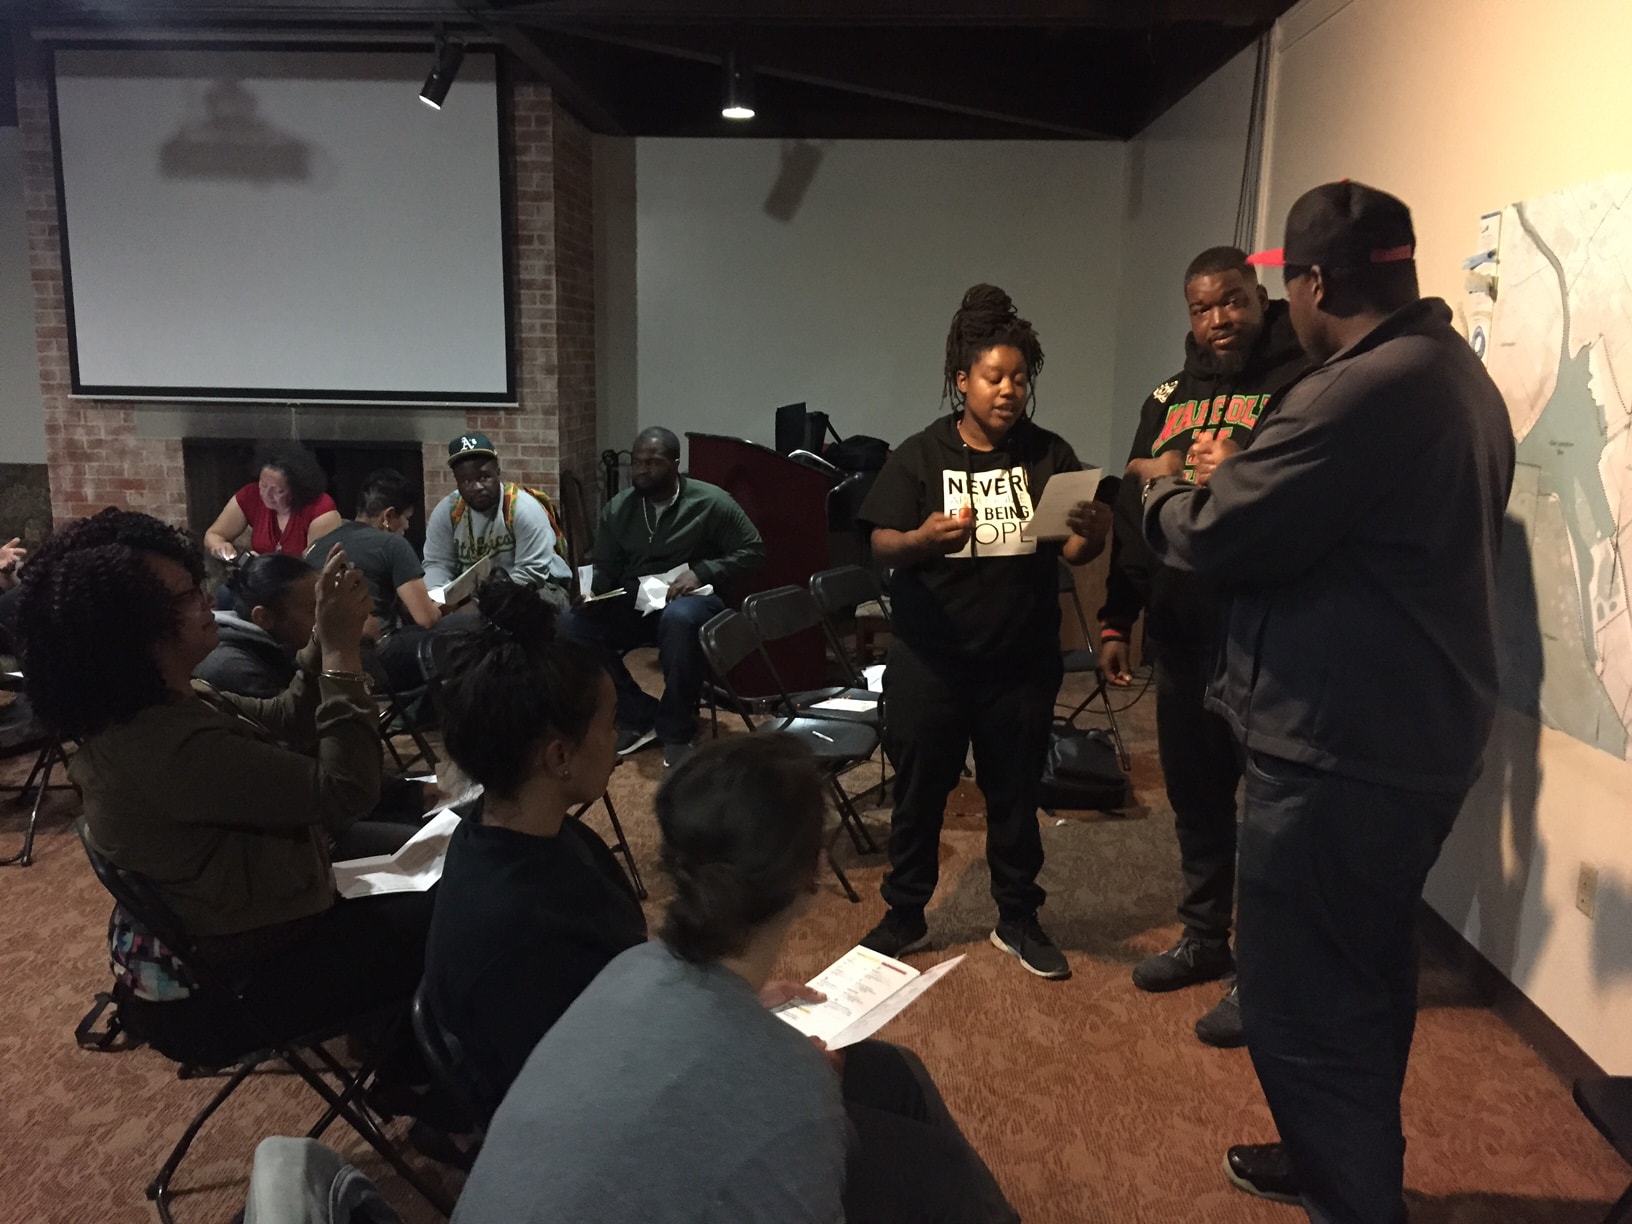
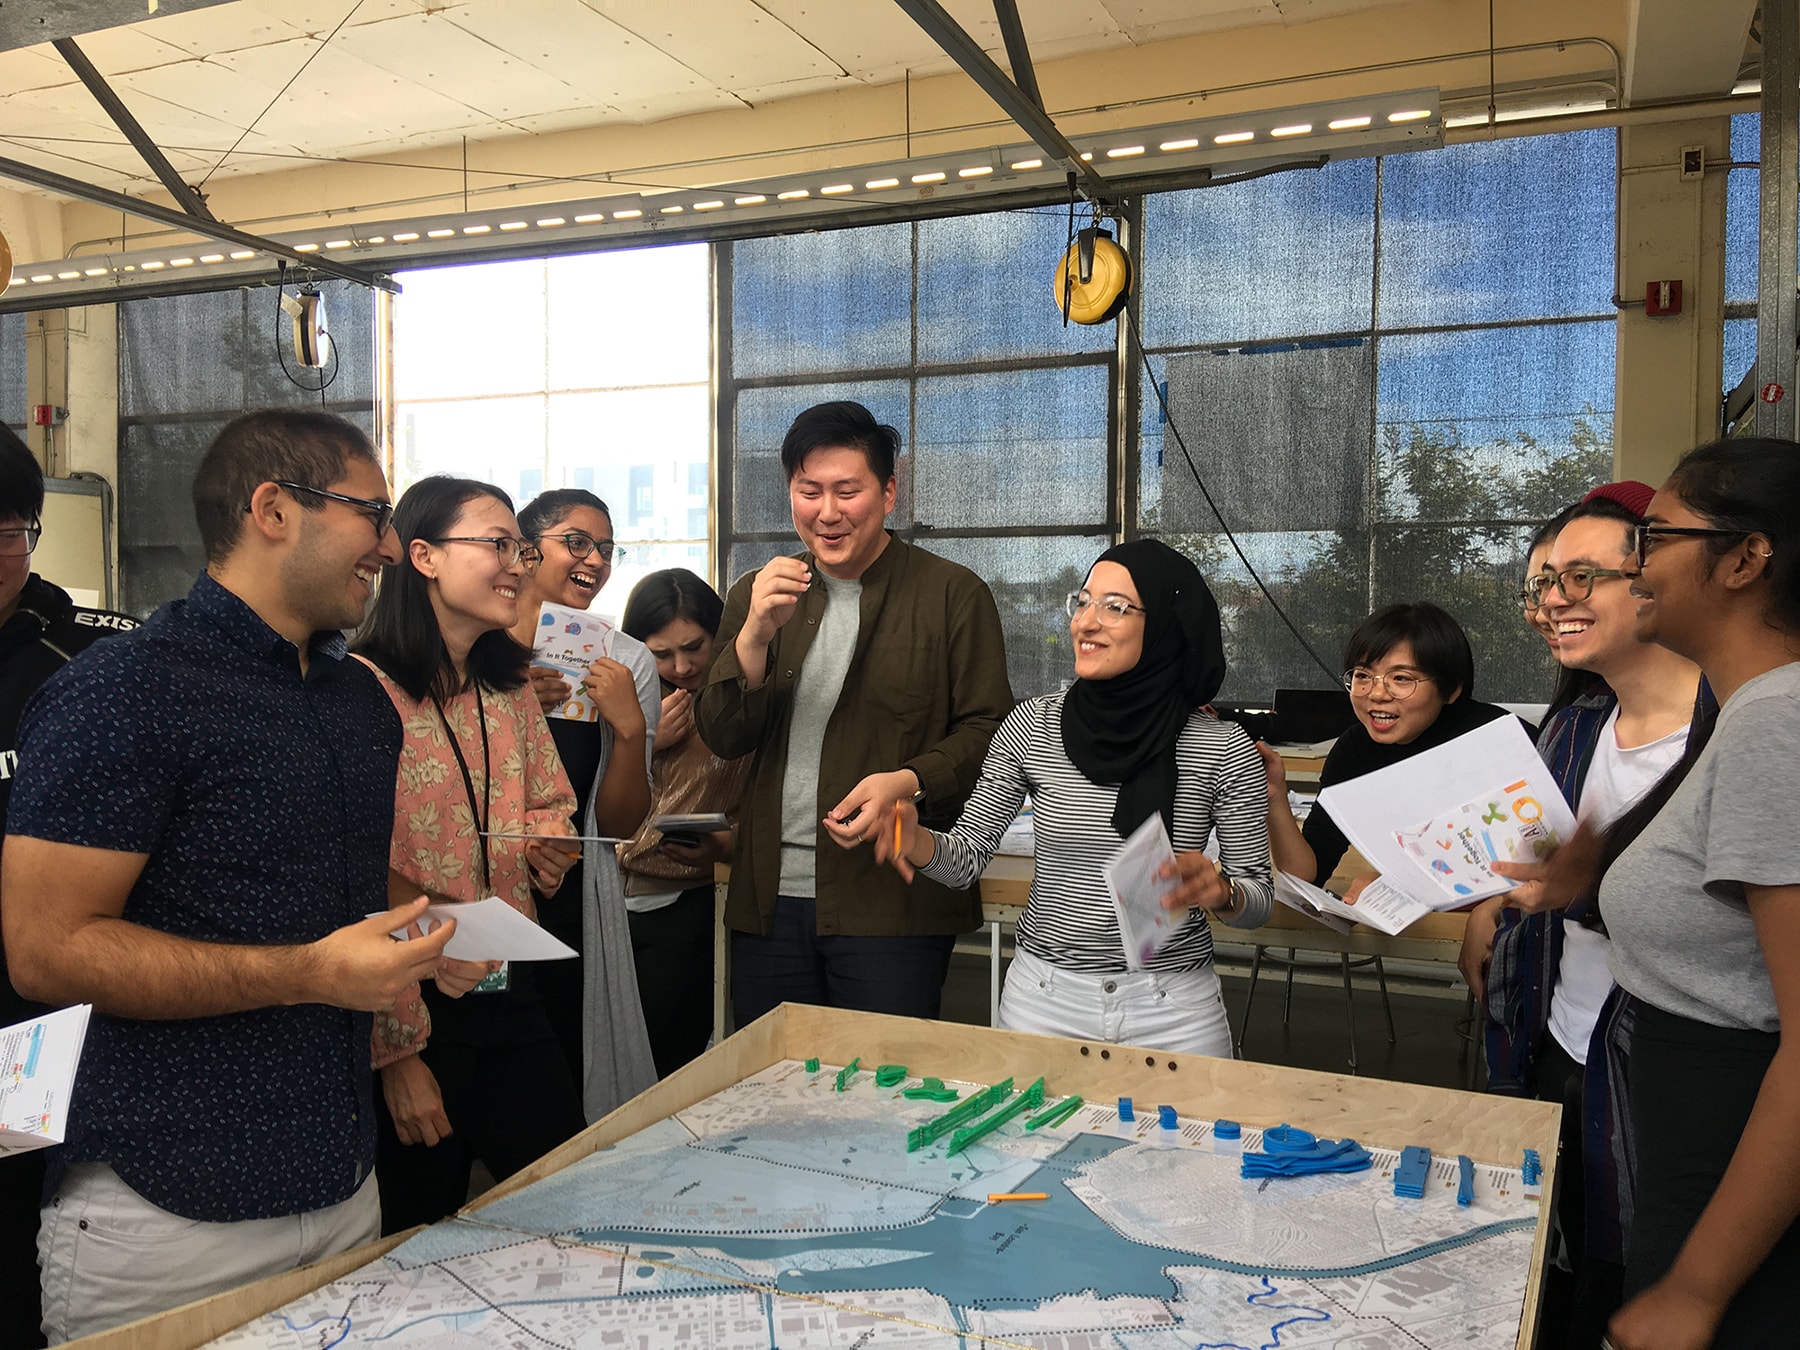
The following designs for a place specific socio-ecological biomass infrastructure build onto the logics articulated in the previous sections. Firstly, Central Limburg’s pre-industrial landscape economies collectively redistributed natural material flows, working the heath landscape as a common resource pool. Secondly, RLLK’s biomass square project and supporting infrastructure clearly frame economic revenue from biomass in a broader mission of landscape restoration and farmer empowerment. The following designs incorporate these two notions and project how rolling out this new biomass infrastructure in HH could empower even more actors and address even more site-specific environmental challenges. The designs result from a sequence of design studios, on-site fieldwork, desktop research, regular stakeholder consultations through workshops and meetings with administrations, culminating in an intensive international urban landscape design workshop with stakeholders in February 2016 and a master thesis in 2017 [13]. The designs envision the new biomass logistical chain as a hybrid infrastructure reviving inhabitants’ relationship with their natural environment as well as an opportunity to reconnect currently disconnected actors and spaces in synergetic collaborations and programs (Figure 7).

­­

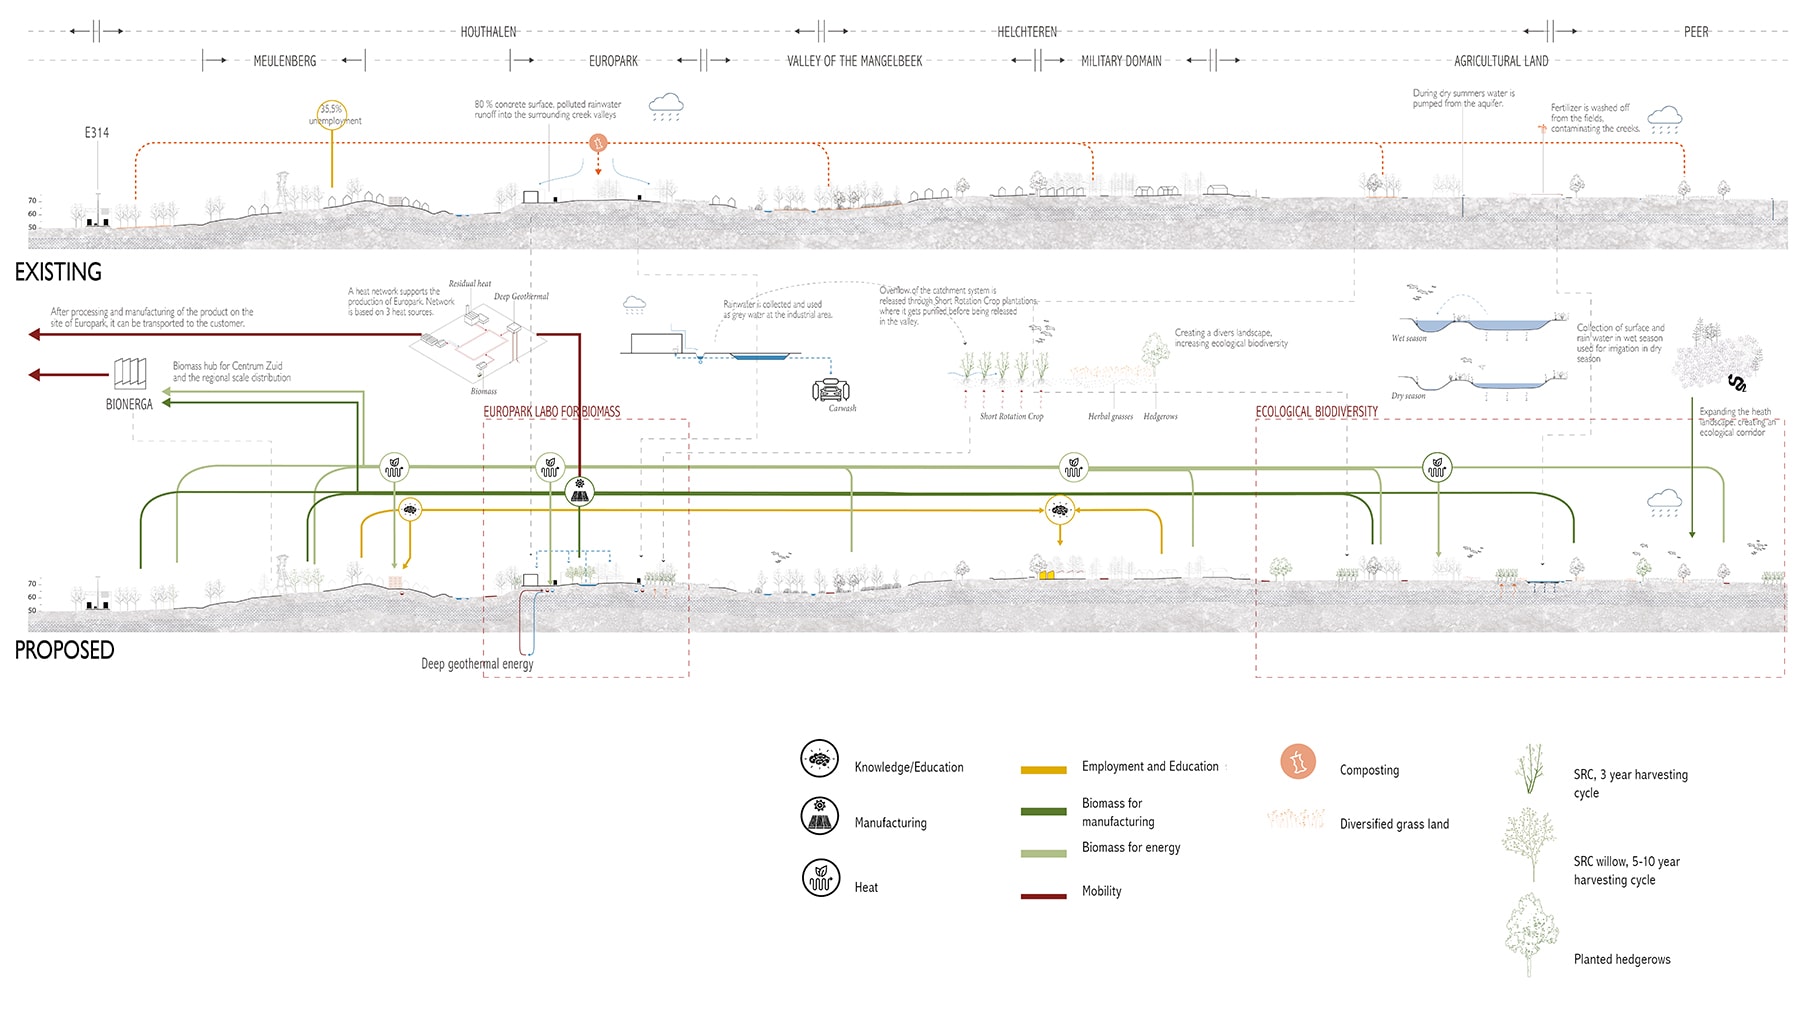
Figure 7. Projected landscape transformations with the introduction of a contextualized biomass infrastructure including education and job creation, water management and purification and landscape biodiversification


Figures 8 and 9 below imagine how HH’s metabolic shift to clean technology and reuse of waste flows could become a lever for social innovation in Meulenberg. It connects investments in biomass infrastructure to social challenges in that area and imagines them. At the turn of the century, the former utopic garden city had transformed into a spatially isolated and stigmatized social housing enclave. At the time of the design workshop in 2016, youth unemployment in Meulenberg was one of the highest in Limburg and tensions in this area were significant [14]. Working in close collaboration with HH’s civil servant responsible for housing and spatial planning, the designers gained some insight in Meulenberg’s complex challenges. The designers conducted fieldwork by bicycle, visiting Meulenberg’s community spaces, such as collective gardens and kitchens, and other key places in Meulenberg’s social tissue.

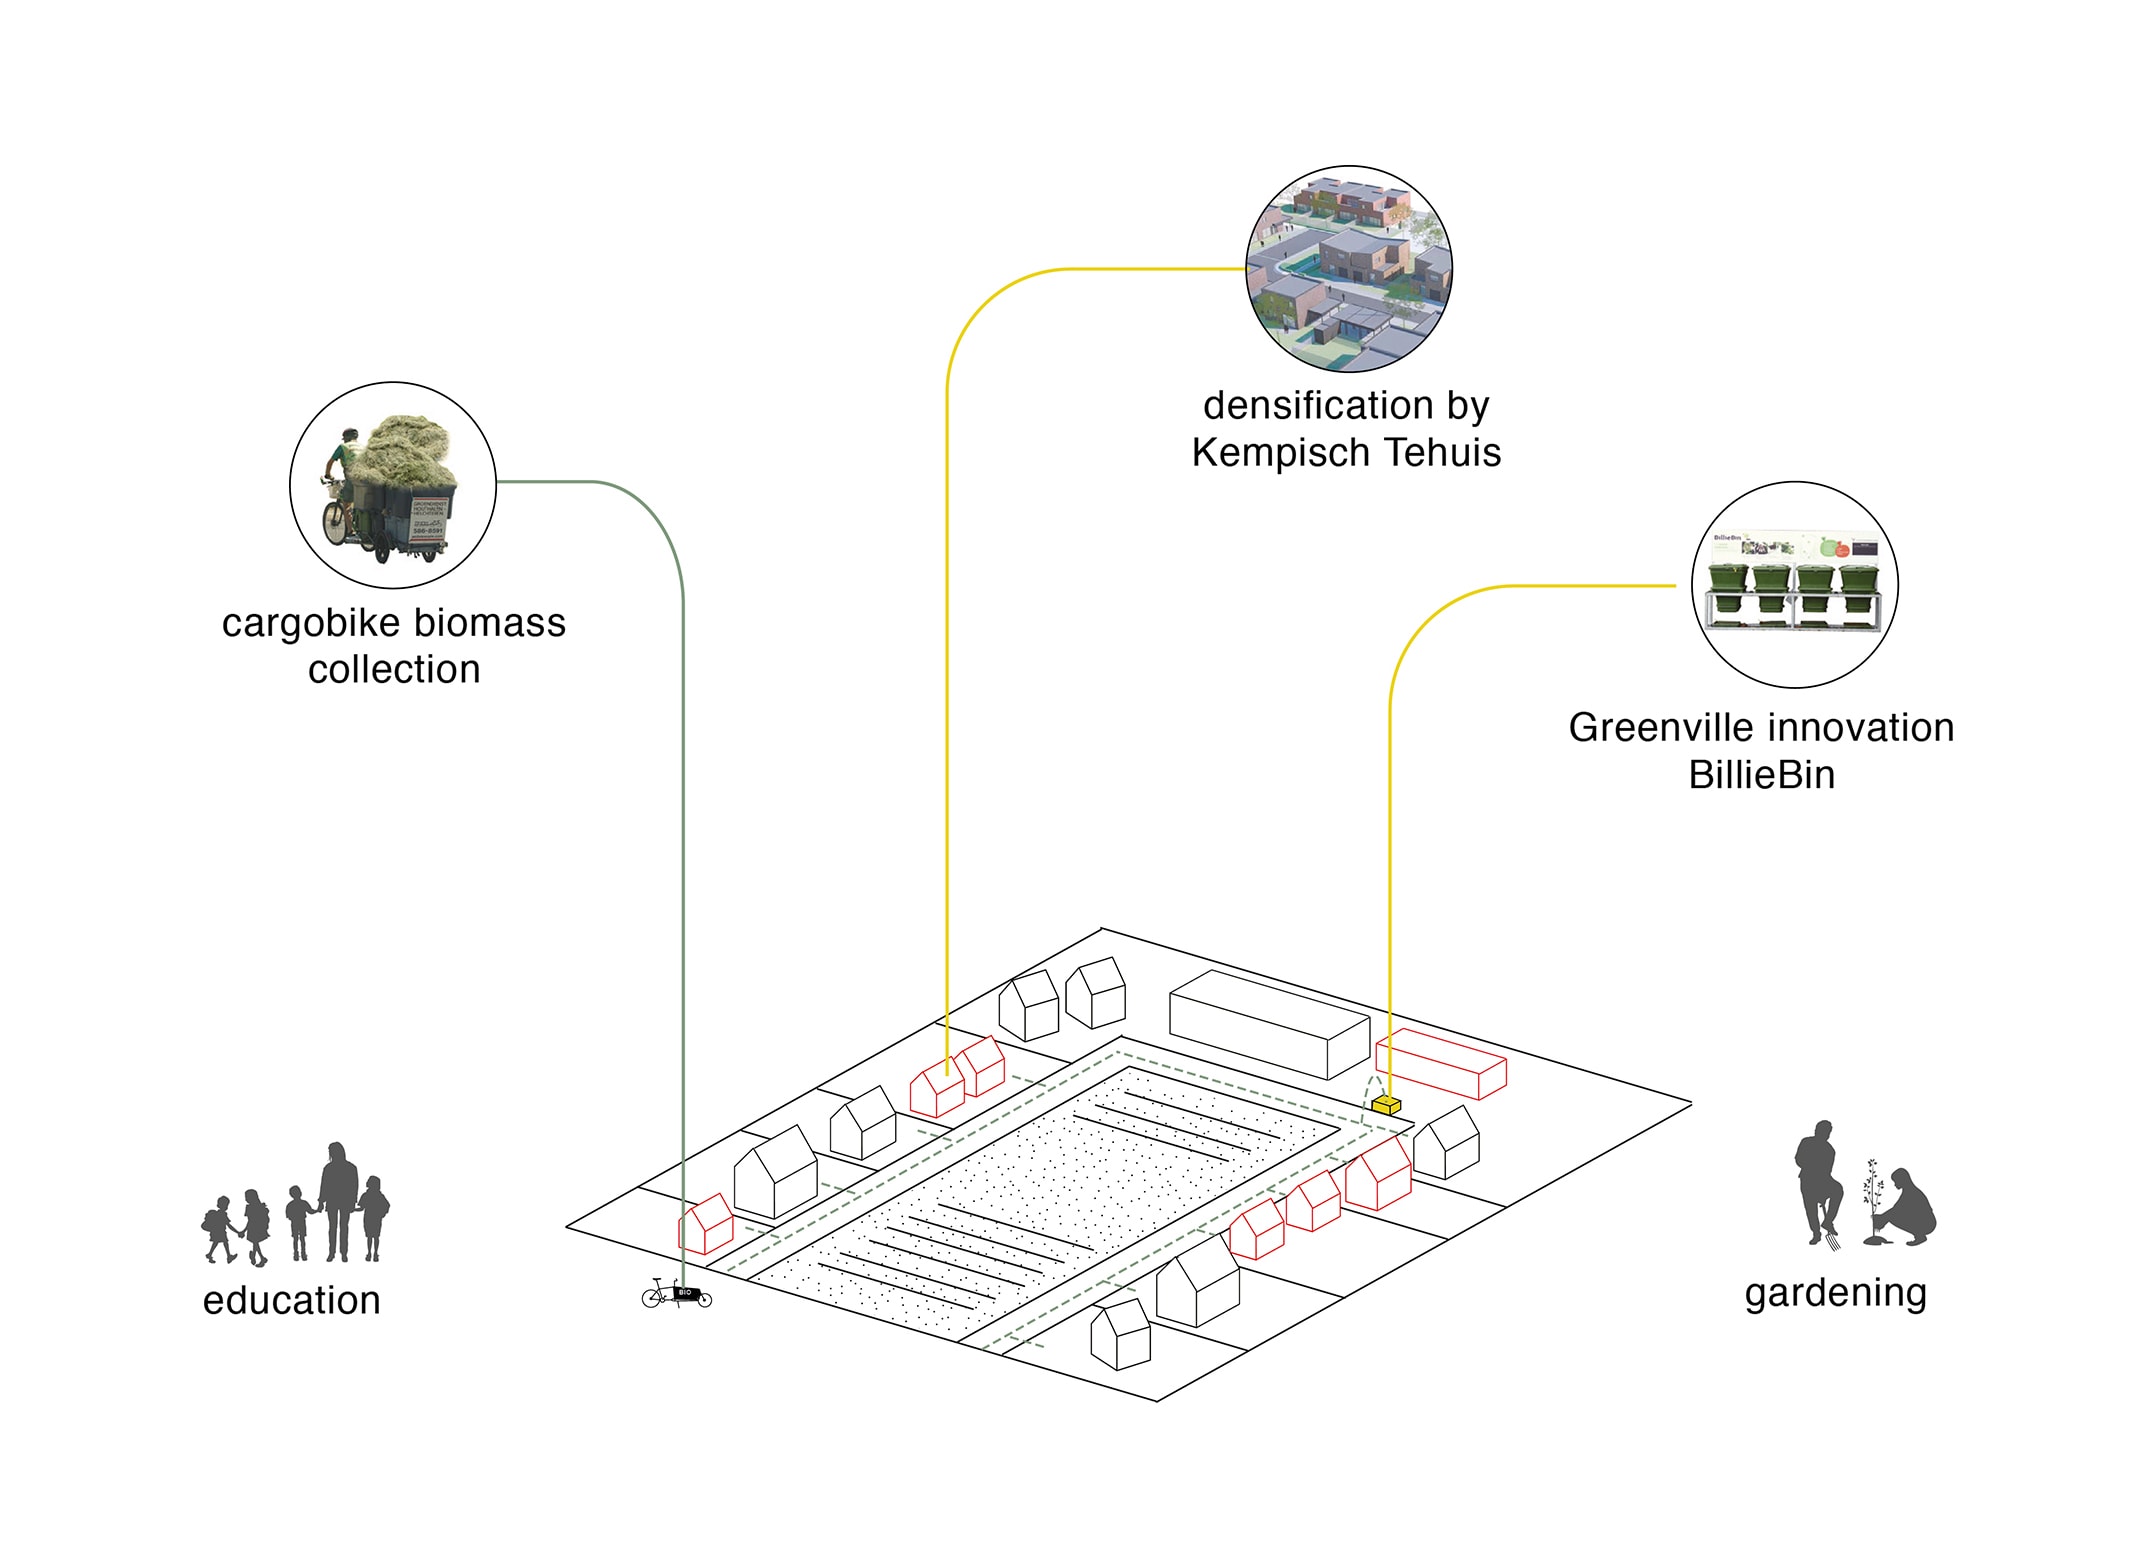
Figure 8. imagines how the biomass infrastructure in HH could become a lever for social innovation in Meulenberg.


The design proposal below explores new ways to reconnect Meulenberg to HH’s social, economic and spatial tissue, through synergies with existing initiatives in HH, such as clean tech incubator Greenville and the new biomass square. An intervention to catalyze this transformation is proposed in Meulenberg’s center, a large parking lot next to a school bordered by one of the remaining social housing towers soon to be demolished. This public space can become a ‘testing ground’ for collaborations between Meulenberg’s population, Greenville and the planned regional biomass hub in HH (Figure 9).

A clean tech satellite in Meulenberg could be a testing ground for clean tech prototypes related with typical Meulenberg activities while creating local jobs. For example, the Greenville Billiebin [15], a low-tech composting bin using worms, could be tested, evaluated and refined using Meulenberg gardeners and cooks’ expertise. The vacant tower building could be occupied as a pop-up Greenville satellite, with workplaces and laboratories, using the blind façade as a billboard. The suggested activities could go hand in hand with a collection point for landscape waste to be transported to HH’s new biomass hub with cargo bikes. This productive central space in Meulenberg could house local farmer’s markets and become a demonstration site for the community farming already having a long tradition in Meulenberg. In a few years, the historical connection between Greenville and Meulenberg could be revived through a combination of social and economic innovations, guided by spatial interventions and initiatives.

Figure 9. Envisioned transformation of a vacant parking lot in Meulenberg with the inclusion of programs supporting the new biomass infrastructure while empowering the local population.


In a similar way, schools could play active roles in the collection of organic waste from households. Coupling the biomass infrastructure development to education increasingly includes actors and raises awareness about people’s potential roles in landscape and ecosystem stewardships.

Figure 10. Europark becomes the new spill in the biomass economy by housing the biomass square as a bridge between the local and natural tissue.


Finally, the design research envisioned how on a larger scale biomass recovery and landscape restoration could simultaneously contribute to the construction of an ecological corridor. The reconversion of industry park Europark as a key in the biomass recovery gradually stitches landscape structures into the required ecological connections.

In the beginning selecting strategic biomass sheds can create win-wins for the overall landscape restoration. In time, the maintenance of the landscape within the biomass economy will expand. Europark as ‘biolabo’ park is introduced, adopting its empty lots as catalysts for biomass related industries. More to the north at the former military domain ‘de kazerne’ a new knowledge center can function as entrance to the domain for local inhabitants and as a local learning center to become experts in harvesting biomass from landscape maintenance. In this manner creating a local embedded economy answering to the higher unemployment rates of low educated people in the region.

Once these structures are implemented, they can be enhanced by extending the bicycle network, connecting the municipality’s main infrastructure with the military domain and the ecological corridor. Creating a knowledge bike path, where the changing of the landscape and the economic value of the landscape is put at front.

As such, the designs articulate how the biomass infrastructure development could reinforce community building as well as contribute to the regional ecological networks. Even though the design investigations for a socio-ecological biomass infrastructure in this paper don’t explicitly address politics or power, fair redistribution of the surplus values captured from biomass recovery is clearly at the heart of the designs. Local actors and stakeholders from the municipality and RLLK fed the design process and vice versa, the design process inspired them with tangible alternatives.

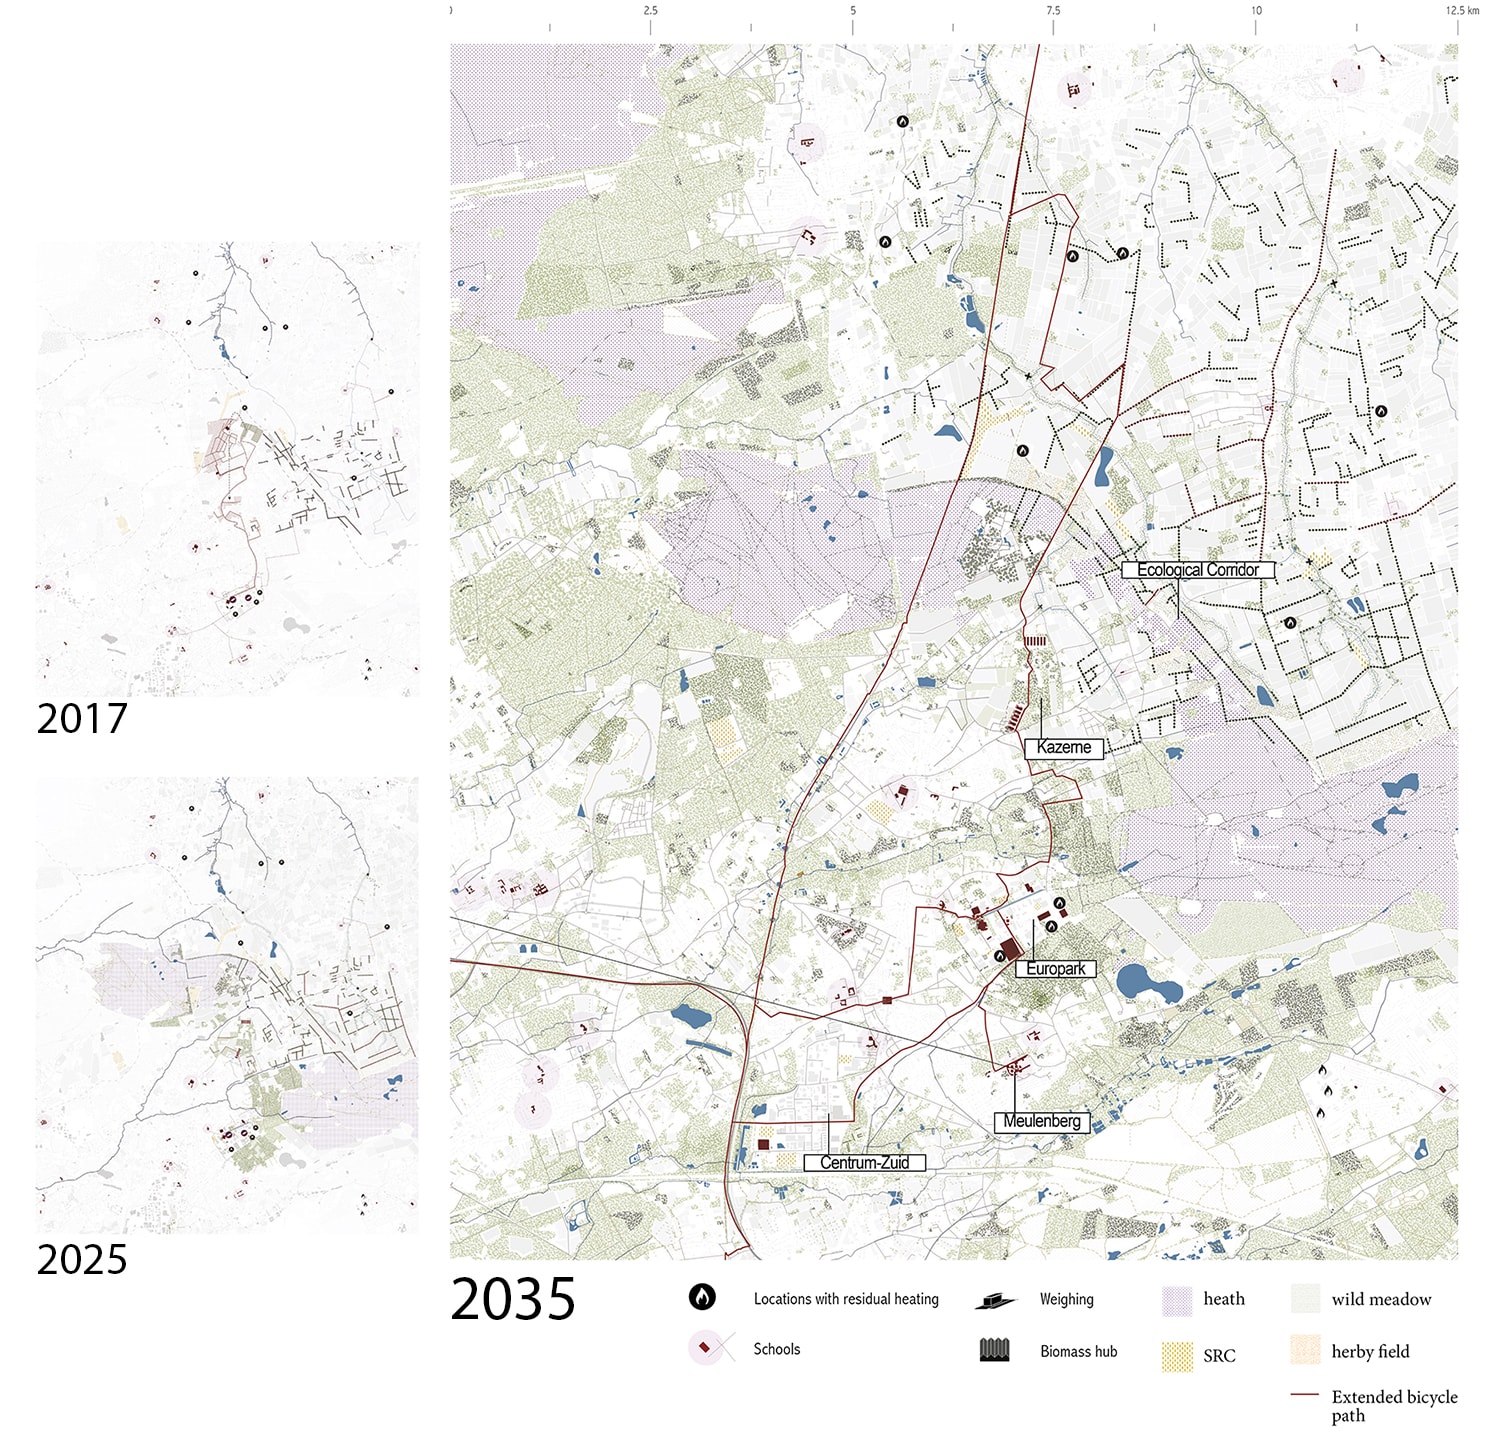
Figure 11. The implementation of the biomass economy in HH is overall used as a landscape structuring devise. Increasing the ecological value of the region and reinforce community building.


Designer Roles

Energy and materials transition in Flanders will inevitably go hand in hand with transforming landscapes. Adopting place-based imaginaries of these possible transformations, urban designers can simultaneously help reimagining social and political conditions.

Co-created future imaginaries open a world of possibilities and communicate them to stakeholders. They synthesize social, economic and ecologic questions in space as a starting point to imagine alternative territorial metabolisms. Future imaginaries mediate between different agendas and interests and indicate potential involvement, relationships between users, makers, decision-makers. They act as an invitation for any discipline to engage in the articulation of the future. The future imaginary functions as a common language between politics, administration, economics, market, ecology, with the capacity to absorb distinct perspectives. Future imaginaries initiate conversations and redirect them from theoretical conversations about principles to concrete explorations of needs, and application of principles. They translate a set of perceived problems into a series of opportunities, triggering ‘ah-ha’ moments in non-hierarchical ways. Their creation process allows continuous absorption of stakeholder or expert reactions in an iterative way. The future imaginary is projective per definition, meaning it creates a new fact. It’s not about discussions about what is, but about reactions to concrete possibilities, tested in a minimal way, through the creative act of drawing.


Julie Marin studied engineering architecture at Ghent University (’07) and urban design at the GSAPP, Columbia University (’12). Her PhD design research is entitled ‘Circular Economy Transition in Flanders. An Urban Landscape Design Contribution’ (University of KU Leuven ’19). Before 2015 Julie worked as architect at the City of Antwerp and as urban designer at Scape / Landscape Architecture in New York City. She was Associate in Architecture at the GSAPP Urban Design Program and currently teaches in urban design studios and design seminars at KU Leuven.


Charlotte Timmers (1991) studied engineering architecture at the University of KULeuven, and graduated from the postgraduate master of Urbanism and strategic planning at KULeuven in 2016. She currently works for the Flemish Government on territorial development for the Department of Environment. She has a strong interest in the interplay between productive landscapes and the ecological and social relations they could initiate.


Bruno De Meulder (1960) studied architecture at the University of KULeuven where he also developed a doctoral dissertation on urbanism in the Belgian Congo. Currently, he teaches urbanism at the KULeuven where he is vice-director of the Department of Architecture and co-director of the post-graduate programs of human settlements and urbanism. In his research theory and practice, analysis and design, history and contemporary urban practices cross.


Notes

[1] “Energiecooperaties en crowdfunding in Vlaanderen”, Vlaamse overheid, accessed May 22, 2019. https://apps.energiesparen.be/energiekaart/vlaanderen/cooperaties

[2] Graham, Stephen and Simon Marvin. Splintering urbanism: networked infrastructures, technological mobilities and the urban condition. Repr. ed. London: Routledge, 2003.

[3] Soares, Pedro Paulo. “Gandy, Matthew. 2014. The Fabric of Space: Water, Modernity, and the Urban Imagination. Cambridge USA: The MIT Press. Reviewed by Pedro Paulo Soares.” Journal of Political Ecology 22, no. 1 (2015): 488-89.

[4] De Block, Greet. “Ecological Infrastructure in a Critical-Historical Perspective: From Engineering ‘Social’ Territory to Encoding ‘Natural’ Topography,” Environment and Planning A, no.48 (2) (2016): 367–390.

[5] Orff, Kate as quoted in “The Green New Deal is really about designing an entirely new world”, accessed October 29, 2019. https://www.curbed.com/2019/9/19/20872719/green-new-deal-infrastructure-design

[6] “Rapport: Energielandschappen”, (March 2016) accessible in full at https://www.vlaamsbouwmeester.be/nl/instrumenten/labo-ruimte/energielandschappen

Follow up of this rapport is the Strategic Project ‘Energielandschappen Oost-Vlaanderen’, accessed May 22, 2019. https://www.energielandschap.be/.

Labo Ruimte. “Rapport: Atelier Diepe geothermie”, (March 2016) accessible in full at https://www.vlaamsbouwmeester.be/nl/instrumenten/labo-ruimte/atelier-diepe-geothermie

[7] ‘Biomassaplein’ (2018), Biomassaplein cvba. accessed May 22, 2019, https://www.biomassaplein.be/

[8] ‘Digitaal platform voor Landschapsbeheer’, Profisi, accessed May 22, 2019. http://www.dipla.be/dipla.html

[9] Dehaene, Michiel “Circulaire gebiedsontwikkeling – een skeptische reflectie. Pleidooi voor een metabolische praktijk?” presented at Denktank Circulaire Gebiedsontwikkeling OVAM-OVK 24 April 2019

[10] Van Acker, Maarten. “An emerging national test site.” In From flux to frame: designing infrastructure and shaping urbanization in Belgium, 36-40. Leuven: Leuven University Press, 2014.

[11] Kaland, Peter Emil. “Heathlands – Land-use, ecology and vegetation history as a source for archaeological interpretations.” In Gulløv: Hans Christian: Northern Worlds, Landscapes, interpretations and dynamics, 19-47. Publications from the National Museum of Denmark, Studies in Archaeology & History Vol 22, Copenhagen, 2014

[12] Marin, Julie and Bruno De Meulder, “Urban landscape design exercises in urban metabolism: reconnecting with Central Limburg’s regenerative resource landscape.” Journal of Landscape architecture (Jola), no. 13:1 (2018): 36-49.

[13] The discussed design investigations in Houthalen-Helchteren were initiated and coordinated by OSA (Research group of urbanism and architecture) as part of a PhD project by Julie Marin (2014-2019) and a master thesis by Charlotte Timmers (2016-2017), supervised by Prof. Bruno De Meulder. More details on the designs, studio and workshop participants can be consulted in the following reports:

Julie Marin, Matteo Motti and Bruno De Meulder (eds.), Waste(d). Connecting Cycles, Rethinking Infrastructures (KU Leuven, 2015), https://issuu.com/ juliemarin5/docs/booklet_campine_stu­dio_2015_email

Julie Marin, Erik Vandaele and Bruno De Meulder (eds.), Upcycling Limburg. Evisioning Transition along the Coal Track (University of Leuven, 2015), https://issuu.com/juliemarin5/ docs/upcycling_limburg_mahsmausp_ fall201

Julie Marin, Matteo Motti and Bruno De Meulder, ‘Atelier # 1’, in: Joeri De Bruyn et al. (eds.), Het Kolenspoor getest (Mechelen: Public Space en Ruimte Vlaanderen, 2016), 189–248, https:// issuu.com/toplimburg/docs/atlas_iabr_ final_v3_13-04-2016.comp.

Timmers, Charlotte “Biomassing Central Limburg: Towards a socio-ecological structuring of Houthalen-Helchteren.” Thesis diss., Catholic University of Leuven (KULeuven), 2017.

[14] Media report riots in Meulenberg in 2013 and razzia’s in 2015.

“ Rellen in Houthalen: agent loopt schedelfractuur op.” Het laatste nieuws, October 11, 2013. https://www.hln.be/nieuws/binnenland/rellen-in-houthalen-agent-loopt-schedelfractuur-op~a14f42a8/.

MaLu, “Opnieuw grootschalige drugactie in Meulenberg.” Het belang van Limburg, October 12, 2015. https://www.hbvl.be/cnt/dmf20151012_01914905/opnieuw-grootschalige-drugactie-in-meulenberg.

[15] ‘Billie Bin’ (2014-2019), Green provision bvba, accessed May 22, 2019. https://www.billiebin.com/


Figure sources

Figure 1-7 and 10-11: Timmers, Charlotte, “Biomassing Central Limburg: Towards a socio-ecological structuring of Houthalen-Helchteren.” Thesis diss., Catholic University of Leuven (KULeuven), 2017.

Figure 8-9: Marin, J., Motti M., De Meulder B. Atelier # 1. In: Het kolenspoor getest. Mechelen: Public space. p.35 (2016). (see also note 12)


Acknowledgements

This research is made possible with the support of the Research Foun­dation-Flanders (FWO). The authors would like to thank the municipality of Houthalen-Helchteren, Departement Omgeving Vlaanderen, and Regio­naal Landschap Lage Kempen for their contributions to the design research. Furthermore, thank you to our design studio collaborators Matteo Motti, and Erik Van Daele, as well as the participants of the University of Leuven’s Ur­banism Studios in 2015 and Urban Landscape Design Workshop in Houtha­len-Helchteren in 2016. More details on the design results and the names of the participants can be consulted via links in note 13.


Cite 

Julie Marin, Charlotte Timmers, and Bruno De Meulder, “Biomass for all: designing an inclusive biomass infrastructure in Central-Limburg, Flanders,” Scenario Journal 07: Power, December 2019, https://scenariojournal.com/article/biomass-for-all/.


China’s Giant Transmission Grid Could Be The Key To Cutting Climate Emissions

In early February, Chinese workers began assembling a soaring red-and-white transmission tower on the eastern edge of the nation’s Anhui province. The men straddled metal tubes as they tightened together latticed sections suspended high above the south bank of the Yangtze River.

The workers were erecting a critical component of the world’s first 1.1-million volt transmission line, at a time when US companies are struggling to build anything above 500,000 volts. Once the government-owned utility, State Grid of China, completes the project next year, the line will stretch from the Xinjiang region in the northwest to Anhui in the east, connecting power plants deep in the interior of the country to cities near the coast.

The transmission line will be capable of delivering the output of 12 large power plants over nearly 2,000 miles (3,200 kilometers), sending 50% more electricity 600 miles further than anything that’s ever been built. (Higher-voltage lines can carry electricity over longer distances with lower transmission losses.) As one foreign equipment provider for the project boasts, the line could ship electricity from Beijing to Bangkok—which, as it happens, only hints at State Grid’s rising global ambitions.

The transmission of power over great distances with high-voltage DC transmission systems reduces the CO2 emissions due to smaller energy losses. But are the country’s next-generation power lines a clean-power play or a global power move? An HVDC power transformer. Photo by Worklife Siemens.


The company initially developed and built ultra-high-voltage lines to meet the swelling energy appetites across the sprawling nation, where high mountains and vast distances separate population centers from coal, hydroelectric, wind, and solar resources. But now State Grid is pursuing a far more ambitious goal: to stitch together the electricity systems of neighboring nations into transcontinental “supergrids” capable of swapping energy across borders and oceans.

These massive networks could help slash climate emissions by enabling fluctuating renewable sources like wind and solar to generate a far larger share of the electricity used by these countries. The longer, higher-capacity lines make it possible to balance out the dimming sun in one time zone with, say, wind, hydroelectric, or geothermal energy several zones away.

Politics and bureaucracy have stymied the deployment of such immense, modern power grids in much of the world. In the United States, it can take more than a decade to secure the necessary approvals for the towers, wires, and underground tubes that cut across swaths of federal, national, state, county, and private lands—on the rare occasion when they get approved at all.

“A long-distance interconnected transmission grid is a big piece of the climate puzzle,” says Steven Chu, the former US energy secretary, who serves as vice chairman of the nonprofit that State Grid launched in 2016 to promote international grid connections. “China is saying ‘We want to be leaders in all these future technologies’ instead of looking in the rear-view mirror like the United States seems to be doing at the moment.”

But facilitating the greater use of renewables clearly isn’t China’s only, or even primary, motivation. Transmission infrastructure is a strategic piece of the Belt and Road Initiative, China’s multitrillion-dollar effort to build development projects and trade relationships across dozens of nations. Stretching its ultra-high-voltage wires around the world promises to extend the nation’s swelling economic, technological, and political power.

Long-distance transmission is a big piece of the climate puzzle. Wind turbine along the train line between Tianjin to Shanghai. Photo by Victor Wong.


23,000 miles of wires

State Grid is probably the biggest company you’ve never heard of, with nearly 1 million employees and 1.1 billion customers. Last year, it reported $9.5 billion in profits on $350 billion in revenue, making it the second-largest company on Fortune’s Global 500 list.

State Grid is already the biggest power distributor in Brazil, where it built its first (and still only) overseas ultra-high-voltage line. The company has also snapped up stakes in national transmission companies in Australia, Greece, Italy, the Philippines, and Portugal. Meanwhile, it’s pushing ahead on major projects in Egypt, Ethiopia, Mozambique, and Pakistan and continues to bid for shares in other European utilities.

“A lot of Chinese companies are very ambitious in spreading overseas,” says Simon Nicholas, a co-author of a report tracking these investments by the Institute for Energy Economics and Financial Analysis, a US think tank. “But State Grid is on another level.”

State Grid was created in late 2002, when the government broke up a massive monopoly, the State Power Corporation of China, into 11 smaller power generation and distribution companies. That regulatory unbundling was designed to introduce competition and accelerate development as the nation struggled to meet rising energy demands and halt recurrent blackouts. But State Grid was by far the larger of two resulting transmission companies, and it operates as an effective monopoly across nearly 90% of the nation.

In 2004, the Communist Party handpicked Liu Zhenya, the former head of Shandong province’s power bureau, to replace the retiring chief executive of State Grid. Liu, a savvy operator with a talent for navigating party politics, almost immediately began to lobby hard for ultra-high-voltage projects, according to Sinews of Power: The Politics of the State Grid Corporation of China by Xu Yi-Chong, a professor at Griffith University in Australia.

Lines capable of sending more energy over greater distances could stitch together the nation’s fragmented grids, instantly delivering excess electricity from one province to another in need, Liu argued. Later, as China came under growing pressure to clean up pollution and greenhouse-gas emissions, State Grid’s rationale evolved: the power lines became a way to accommodate the growing amount of renewable energy generation.

Transmission lines seen from the train from Tianjin to Shanghai. Photo by Victor Wong.


From the start, critics asserted that State Grid was pushing ultra-high-voltage transmission primarily as a means of consolidating its dominant position, or that the new technology was an expensive and risky way of shoring up rickety energy infrastructure.

But Liu’s arguments won out: early projects were approved and built, and party leaders soon prioritized ultra-high-voltage technology in China’s influential five-year plans.

The company at first collaborated closely with foreign firms developing transmission technology, including Sweden’s ABB and Germany’s Siemens, and it continues to buy some equipment from them. But it quickly assimilated the expertise of its partners and began developing its own technology, including high-voltage transformers as well as lines that can function at very high altitudes and very low temperatures. State Grid has also developed software that can precisely control the voltage and frequency arriving at destination points throughout the network, enabling the system to react rapidly and automatically to shifting levels of supply and demand.

The company switched on its first million-volt alternating current line in 2009 and the world’s inaugural 800,000-volt direct current line in 2010. State Grid, and by extension China, is now by far the world’s biggest builder of these lines. By the end of 2017, 21 ultra-high-voltage lines had been completed in the country, with four more under construction, Liu said during a presentation at Harvard University in April.

Collectively, they’ll stretch nearly 23,000 miles and be capable of delivering some 150 gigawatts of electricity—roughly the output of 150 nuclear reactors.

At the end of last year, China had poured at least 400 billion yuan ($57 billion) into the projects, according to Bloomberg New Energy Finance. After a slowdown in new project approvals during the last two years, China’s National Energy Administration said in September that it will sign off on 12 new ultra-high-voltage projects by the end of 2019.

“The fact of the matter is, the Chinese are the only ones seriously building it at this point,” says Christopher Clack, chief executive of Vibrant Clean Energy and a former researcher with the US National Oceanic and Atmospheric Administration. In a study published in Nature in 2016, Clack found that using high-voltage direct-current lines to integrate the US grid could cut electricity emissions to 80% below 1990 levels within 15 years (see “How to get Wyoming wind to California, and cut 80% of US carbon emissions”).

The common destiny of mankind — high-voltage goes global. An underground-to-overhead connection in Guangzhou, China. Photo by Harbindave.


Going Global

In late February of 2016, Liu walked to the lectern at an energy conference in Houston and announced an audacious plan: using ultra-high-voltage technology to build an energy network that would circle the globe.

By interconnecting transmission infrastructure across oceans and continents, in much the way we’ve intertwined the internet, the world could tap into vast stores of wind power at the North Pole and solar along the equator, he said. This would clean up global electricity generation, cut energy costs, and even ease international tensions.

“Eventually, our world will turn into a peaceful and harmonious global village, a community of common destiny for all mankind with sufficient energy, blue skies, and green land,” he said.

Of course, such a global grid won’t happen. It would cost more than $50 trillion and require unprecedented—and unrealistic—levels of international trust and cooperation. Moreover, few nations are clamoring for these kinds of high-voltage lines even within their boundaries.

A handful of countries already exchange electricity through standard transmission lines, but efforts to share renewable resources across wide regions have largely gone nowhere. Among the notable failures is the Desertec Industrial Initiative, an effort backed by Siemens and Deutsche Bank a decade ago to power North African, Middle Eastern, and European electricity grids with solar power from the Sahara.

But State Grid’s global grid plan is basically a sales pitch for its long-distance transmission lines, promoting them as a fundamental enabling technology for the clean-energy transition. If all the company ever achieves are the opening moves in the vision of global interconnectivity, and it develops regional grids connecting a handful of nations, it could still make a lot of money.

Notably, at a conference in Beijing the month after Liu’s speech, the company signed a deal with Korea Electric Power, Japan’s Softbank, and Russian power company Rosseti to collaborate on the development of a Northeast Asian “supergrid” connecting those nations and Mongolia.

Softbank boss Masayoshi Son had proposed a version of the supergrid independent of State Grid back in 2011, after the Fukushima nuclear catastrophe underscored the fragility of Japan’s electricity sector.

Kenichi Yuasa, a spokesperson for the conglomerate, said feasibility studies completed in 2016 and 2017 showed that grid connections between Mongolia, China, Korea, and Japan, as well as a route between Russia and Japan, are both “technically and economically feasible.” “We, as a commercial developer, are ready to execute the projects and would like to deliver tangible progress before Tokyo Olympics in 2020,” he said in an e-mail.

In a response to inquiries from MIT Technology Review, State Grid disputed the argument that the broader global interconnection plan won’t happen, or that its driving motivations are primarily financial and geopolitical.

“The great success of UHV technology application in China represents a major innovation of power transmission technology,” the company said in a statement. “State Grid would like to share this kind of technological innovation with the rest of the world, addressing a possible solution to vital concerns for humankind for example, environmental pollution, climate change, and lack of access to electricity supply.”

Paving the road to the future? Power lines in Beijing. Photo by Tauno Tõhk.


Cleaning up or cleaning up?

In fact, though China has built far more ultra-high-voltage lines than any other country in the world, its own grid is still something of a mess. The country is struggling to efficiently balance its power production and demand, and to distribute electricity where and when it is needed. One result is that it isn’t making full use of its existing renewable-power plants. A recent MIT paper noted that China’s rates of renewable curtailment—the term for when plants are throttled down because of inadequate demand—are the highest in the world and getting higher.

Part of the problem is that it’s easier and more lucrative to use “predictable electrons” from sources like coal or nuclear, which provide a constant stream of electricity, than the variable generation from renewables, says Valerie Karplus, former director of the Tsinghua-MIT China Energy and Climate Project. Mandatory quotas for fossil-fuel plants and provincial politics also distort allocation decisions, she adds.

Less than half of the ultra-high-voltage lines built or planned to date in China are intended to transmit electricity from renewable sources, according to a late-2017 report by Bloomberg New Energy Finance.

“Getting the most out of wind, solar, and other intermittent sources will require rethinking how to make grid operations more flexible and responsive,” Karplus said in an e-mail.

Despite its purported green ambitions, State Grid itself has resisted the broader market reforms that would be necessary to lessen China’s dependence on fossil-fuel plants. All of which raises questions about the company’s commitment to cutting greenhouse-gas emissions, and how much the long-distance lines will really help to clean up power generation elsewhere.

Tellingly, State Grid’s main target markets are in poor countries where fossil-fuel plants dominate and Chinese companies are busy building hundreds of new coal plants. So there’s little reason to expect that any ultra-high-voltage lines built there would primarily carry energy from renewable sources anytime soon.

“I haven’t seen anything that would make me think this is part of a green-development initiative,” says Jonas Nahm, who studies China’s energy policy at the Johns Hopkins School of Advanced International Studies. “I think State Grid just wants to sell these things anywhere and dominate with its own standards over those developed by Siemens and other companies.”

He believes State Grid’s broader ambitions are tied to the Belt and Road Initiative, through which China’s state banks are plowing trillions into infrastructure projects across Asia and Africa in an effort to sell Chinese goods and strengthen the country’s geopolitical influence. Building, owning, or operating another nation’s critical infrastructure—be it seaports or transmission lines—offers a particularly effective route to exercise soft and sometimes not-so-soft power. “This is really a battle over the developing world,” Nahm says.


This article was originally published in MIT Technology Review, on Nov 8, 2018.


 James Temple is the senior editor for energy at MIT Technology Review, focused on renewable energy and the use of technology to combat climate change.


Cite

James Temple, “China’s Giant Transmission Grid Could be the Key to Cutting Climate Emissions,” Scenario Journal 07: Power, January 2020. https://scenariojournal.com/article/giant-transmission/


2050 – An Energetic Odyssey: Persuasion By Collective Immersion

“It’s clear that we need to start thinking on a different scale, a huge undertaking that demands the utmost in terms of planning, funding, design, and implementation. This grand operation offers major opportunities for the European economy. 

The North Sea, which has been so prominent in our history, will become a pivot in the deep decarbonization of our society, and a source of prosperity for all.”

2050 – An Energetic Odyssey


IABR: 2050 – An Energetic Odyssey from IABR on Vimeo


What is an Energetic Odyssey?

‘2050: An Energetic Odyssey’ is an animated narration showing how the deployment of 25,000 wind turbines on the North Sea could provide some 90% of the electricity demand of the countries bordering the North Sea by 2050. It is designed as a large floor projection of 5.5 meters x 8 meters for the International Architecture Biennale Rotterdam (IABR 2016, themed: The Next Economy), creating an immersive experience.

The floor projection of the 2050 Odyssey animation at the International Architecture Biennale Rotterdam


Motive: a double crisis of the imagination

We observed a crisis of the imagination. The predominant frame in the energy transition holds that fossils are dependent on big installations and centralized state power, while renewables are small and decentralized. This is coupled to a disbelief and skepticism that these ‘soft renewable’ sources will ever be able to fuel an industrial society like ours.

Rather than following this ‘small is beautiful’ frame we wanted to show that a future of renewables can potentially be a massive investment: Big is Beautiful.

We presented an imaginary in which the North Sea would be the powerhouse of renewables. We produced a narrative on how, given the right political ambition and ‘Chinese building speeds’, an energy landscape of thousands of wind turbines might be fitted in one of the world’s most intensively used coastal waters. And moreover, how this grand operation could even result in a positive boost for the marine ecosystem.

Two stills of the Odyssey


The Animated Narrative

The story is told in twelve minutes. At times the narrative closely follows what you see in the projection, and for large parts it roams free using the animation as a backdrop with the calm and the steady unfolding story of the deployment of 25,000 wind turbines. A year-counter displays the time to 2050, while the popping up of infographics show the energy scenario used, the jobs lost and won by substituting the fossil fuel by a renewable offshore industry, the construction island needed to convert AC to DC. Perhaps the most impressive is the illustration of how a turbine park can be shut down when flocks of migrating birds are approaching. At these times the voice-over and the animation are meticulously synchronized. Approaching the end we let the sun come up in the animation while inserted aerial films show the rather moderate visual impact of the wind turbine parks from the shore. The floor projection is supported, first of all by a 12-meter concertina fold containing the scenarios, calculations, and the construction details of the renewable future; and secondly, large flat screens showing contrasting images of the human engineering and the rich underwater life of the North Sea. A third screen summarizes the most important key figures of the narrative.

Two stills of the Odyssey


Behind the screen: the making of…

The interactive production of the installation, in the ‘free cultural domain’ of the IABR, forged a coalition of key actors. These actors not only contributed financially but also gave ‘in kind’ contributions by lending their specialists to inform the narrative and discussing ‘landing rights’ for the intervention. It made the animation an intense collaboration between designers and scientists, and a snowball effect of an expanding consortium with expert input from builders, offshore specialists, ministries, energy firms, a transmission system operator, port authorities, and environmental and nature NGOs. Stakeholders used preliminary versions of the installation and the maps produced by us for their deliberations. Environmental NGOs organized a conference of marine ecologists from the North Sea countries, with the animation used as a backdrop to discuss the pros and cons of such an operation, as well as the ecological development possibilities that they could identify.

Timeline of events, November 2014August 2016. The number of dots express the relative weight of the various groups in the respective meetings. Hajer/Pelzer Energy Research & Social Science 44 (2018) 222–231


Elements of the twelve-meter concertina fold with scenarios and calculations

Impact

Showing the early concepts of the presentation started a buzz, word got around, and ultimately, we were invited to give a ‘sneak preview’ of this giant floor projection to the Energy Ministers of the 28 European countries during the Dutch presidency of the EU. Moreover, on the 6th of June 2016, an agreement was signed between the UK, Ireland, Norway, Sweden, France, Denmark, Germany, Belgium, and the Netherlands to boost cooperation on turning the North Sea into our central energy landscape. Of course, this agreement was not ‘design-driven,’ but interviews reveal that sharing the animation and the narrative played a role in this process.

EU Energy DG’s and Ministers overlooking the animation


Based on the animation, a business-led coalition was formed at the Rotterdam Biennale exhibition to urge the Dutch government to speed up its policies to the energy-transition. The Odyssey (again) proved the power of research by design. It shows that with this kind of research it is possible to address problems that will never have a paying client. While in our day-to-day practice our contribution to the big environmental questions of today may be limited, research by design in the free cultural or academic realms considerably broadens the scope of what design might accomplish.


Dirk Sijmons is one of the founders of H+N+S Landscape Architects. At the office he did mostly regional plans and research projects. H+N+S received the Prince Bernard Culture award in 2001. In 2002 he received the Rotterdam-Maaskant award and in 2007 the prestigious Edgar Doncker award for his contribution to ‘Dutch Culture’. His book publications in English are = Landscape (1998), Greetings from Europe (2008), Landscape and Energy (2014), Moved Movement, (2015) & Room-for-the-River (2017). Sijmons was appointed first State Landscape Architect of the Netherlands (2004-2008). He held the chair of Environmental Design (2008-2011) and that of Landscape Architecture (2011-2015) at TU-Delft. He was curator of IABR–2014 themed Urban-by-Nature. At the World Design summit 2017 in Montreal he received the IFLA sir Geoffrey Jellicoe award.


Maarten Hajer is distinguished professor Urban Futures at the Faculty of Geo Sciences of Utrecht University, director of the UU Urban Futures Studio and scientific director of ‘Pathways to Sustainability’, one of the four Strategic Themes of Utrecht University.

He was educated at the Universities of Amsterdam and Oxford and is the author of over many articles and books, including The Politics of Environmental Discourse (Oxford UP, 1995), Deliberative Policy Analysis (Cambridge UP, 2003, eds. with Hendrik Wagenaar), Authoritative Governance (Oxford UP, 2009) and Smart about Cities – Visualizing the Challenge of 21st Century Urbanism (NAi/010, 2014). His co-authored book ‘Neighbourhoods for the Future – A Plea for a Social and Ecological Urbanism’ is due out in 2020. Hajer is a member of the UN’s International Resource Panel (IRP) for which he leads the working group on Cities, together with Mark Swilling (Stellenbosch). He was the Chief Curator of the International Architecture Biennale Rotterdam in 2016.


Notes

2050 – AN ENERGETIC ODYSSEY. Commissioned by the International Architecture Biennale Rotterdam in the context of

IABR—2016—THE NEXT ECONOMY. Concept and narrative: Maarten Hajer & Dirk Sijmons. Realized by: H+N+S Landscape Architects, Tungsten Pro, ECOFys

In Partnership with: Ministry of Economic Affairs of the Netherlands, Royal Dutch Shell, Port of Rotterdam, Van Oord Offshore, RWE, European Climate Foundation, Port of Amsterdam, Zeeland Seaports, TenneT, Natuur&Milieu Foundation,

With expert advice from: PBL: Environmental Assessment Agency of the Netherlands, The Crown Estate, TU-Delft, Eneco, EBN, ROM3D

Copyright: IABR


Further Reading

IABR—2016 The Next Economy, Catalog, Rotterdam, 2016

Maarten A. Hajer, Peter Pelzer 2050An Energetic Odyssey: Understanding Techniques of Futuringin the transition towards renewable energy Energy Research & Social Science 44 (2018) 222–231

Dirk Sijmons When Research by Design takes Politics on a Sabbatical Detour in: George Brugmans, Jolanda van Dinteren The Next Economy, Catalog of The Next Economy, Catalog of the IABR—2016


Cite

Dirk Sijmons and Maarten Hajer, “2050 – An Energetic Odyssey: Persuasion by Collective Immersion,” Scenario Journal 07: Power, December 2019, https://scenariojournal.com/article/2050-an-energetic-odyssey/.


The Blue Lagoon: From Waste Commons To Landscape Commodity

Oil crises in 1973 and 1979 drove Iceland to reconsider its energy infrastructure, shifting from heavy oil and coal use to domestic sources of energy [1]. This island country’s geographical location and geological activity has yielded a diverse landscape rich in geothermal and hydrological resources. Shaped by powerfully gradual additive and subtractive processes from lava, ice, and water, Icelanders treasure their residency in this dynamic territory that consistently inspires awe. Famously known for its Sagas and folklore, these Icelandic stories highlight critical relationships between culture and landscape, forming sacred places across the country. With an abundance of heated subsurface water and rapidly moving surface water, the Icelandic government saw opportunity to create an energy independent country by tapping into these renewable resources. Extractive methods from the oil and gas industries were adopted to harvest geothermal energy—drilling wells, and pumping and conveying water to generate electricity, while methods from dam making to generate hydropower were adopted at monumental scales. Although these forms of energy production are renewable when compared to oil and gas, they also create both foreseen and unforeseen spatial and material byproducts of abruptly altered landscapes. Icelandic pride in the scenic beauty of their landscape and in the development of domestic forms of renewable energy production are both strongly cultural, and is a tension that has amplified over the last two decades as these sources of energy have become increasingly privatized.

Blue Lagoon complex in foreground, with Svartsengi Geothermal Power Plant in background (July 2018). Photo by Catherine De Almeida.


In the midst of their energy crisis, the National Energy Authority in Iceland began pioneering the development of centralized, geothermal energy production networks. In 1976, the Svartsengi Geothermal Power Plant on the Reykjanes Peninsula in southwest Iceland became the first geothermal Combined Heat and Power (CHP) plant in the world setting the global standard for contemporary geothermal district heating and power production facilities [2]. The geothermal water in this region, however, cannot be directly used due to its distinctive geochemical composition. Geothermal water heats freshwater for regional distribution, while extracted steam runs turbines [3]. Svartsengi currently has an installed capacity of 75 MW for electricity production and 190 MW for heat, providing 45,000 people with electrical power and 17,000 people with hot water [4].

Svartsengi Geothermal Power Plant in foreground, with Blue Lagoon in background and to left (July 2018). Photo by Catherine De Almeida.


Processes that utilize geothermal energy create a byproduct: an output of cooler geothermal effluent [5]. In an attempt to regenerate the water table, brine effluent was released into the adjacent hardened lava-scape. Oxidation of minerals from this geothermal effluent clogged the bedrock’s pores, forming a lagoon [6]. The National Energy Authority originally described this landscape condition—a visible registration of mismanaging byproducts from renewable energy production—as an environmental disaster.

Svartsengi Geothermal Power Plant, with geothermal effluent to left of power plant (July 2018). Photo by Catherine De Almeida.

Svartsengi Geothermal Power Plant, with geothermal effluent at center (July 2018). Photo by Catherine De Almeida.


In typical Icelandic fashion, though, residents perceived the lagoon not as a disgusting byproduct from the industrial process of geothermal energy production, but as warm water to bathe in. Icelandic culture is built around bathing in warm geothermal water wherever it is found, and allowed residents to voluntarily claim this waste landscape as a commons, transforming perceptions of this landscape from undesirable byproduct into an unexpected recreational oasis. Energy and waste produced an emergent cultural landscape. Nearly a decade later in 1987, its popularity led to the construction of a modest bathhouse in order to increase public access [7]. Following capitalist pursuits, by 1999, the Blue Lagoon became further formalized with the design and construction of a complex of buildings: a spa, an R&D center, and a psoriasis clinic [8]. This formalization also privatized this waste landscape.

Geothermal effluent, with Svartsengi Geothermal Power Plant in background (July 2018). Photo by Catherine De Almeida.

Blue Lagoon Spa complex, with new hotel in background (July 2018). Photo by Catherine De Almeida


The Blue Lagoon is now considered one of 25 wonders of the world. With a unique microbial and algal ecosystem in mineral-rich water that generates silica mud (the foundation of its skin product line) [9], it is now the top tourist destination in Iceland, hosting over 1.3 million visitors in 2017 [10]. A human ecology and economy developed out of materials and conditions perceived as waste—the Blue Lagoon’s existence is intrinsically linked to the geothermal power plant.

Visitors apply silica mud, a byproduct of the geothermal effluent, to their skin (July 2018). Photo by Catherine De Almeida.

The Blue Lagoon spa complex consists of the lagoon, restaurants, steam rooms, and a newly constructed hotel (July 2018). Photo by Catherine De Almeida.


However, as the Blue Lagoon has developed over the last decade, so have its developers’ strategies for catering to tourists from cultures that perceive all industrial waste, such as from energy production, as undesirable and potentially harmful. Although the shared waste relationships between power plant and spa industry continue to exist and evolve, this negative perception has resulted in marketing and communication strategies that make these processes less legible to visitors in an attempt to choreograph a high-end, “natural” spa experience. The everyday visitor is both unaware of the Blue Lagoon’s fascinating origins and the ongoing innovative development of sharing waste—resource streams—within a shared, hybrid industrial-recreational waste space.

Recently constructed berms in background block views to the Svartsengi Geothermal Power Plant (July 2018). Photo by Catherine De Almeida.

Steam vents such as the one pictured were strategically place to use steam to block views to the Svartsengi Geothermal Power Plant (July 2018). Photo by Catherine De Almeida.


The spatial and experiential legibility of this manufactured, enviro-technical landscape has become obscured and sterilized. The textural quality of lava rock that once lined the lagoon is now submerged under a layer of concrete. Large volumes of basaltic gravel have been formed into 3-5 meter tall berms, while the strategic placement of steam vents disguise what was once a strong audible, palpable, visual connection between geothermal energy production and geothermal spa. The over-choreography of creating a high-end spa experience is akin to what some have described as a “Disney World” of spas, and is one many visitors feel no need to repeat. The exaggeration of luxuries with increased pricing has made the Blue Lagoon inaccessible, targeting a particular class of tourists. It is no longer culturally Icelandic, but culturally global. The company’s endless reconfiguration of this landscape is motivated by the constant search for how to cater to the mainstream expectations of what a spa “should be,” rather than embrace and create an authentic experience of energy and waste legibility, relinquishing the opportunities to transform pre-conceived notions that all waste is undesirable. This further perpetuates misconceptions that all wastes and industrial processes are “bad,” rather than working to change cultural attitudes toward waste by uncovering its nuances and celebrating its productive qualities.

After reconfiguring the lagoon, areas of the original lagoon were drained, as seen in the foreground of the photograph. The Blue Lagoon spa complex is in the background (July 2018). Photo by Catherine De Almeida.


Waste legibility can be an asset shared by active power generating operations, a novel ecological community, and recreational uses. In the case of the Blue Lagoon, the formalization of this wasteland commons negated a democratic space by creating a high-end, unaffordable, privatized spa industry that conceals the underlying waste reuse frameworks that created the landscape and its unique conditions. What has occurred at the Blue Lagoon parallels the overall development of Iceland’s energy infrastructure—domestic sources of renewable energy and the cultural landscapes from which they are sourced have become internationally privatized, largely through tourism and aluminum smelting. Akin to the ways in which enclosure of the commons in medieval England commodified the landscape, the Blue Lagoon has evolved to become a commodity of landscape consumption—no longer a commons of a productive wasteland, but a commodity to be consumed by global tourists. In order to meet this demand, the narrative of this waste landscape has become suppressed and made invisible in order to cater to the globalized tastes and expectations that a spa and power-generating facilities must be separated—physically through tall lava rock berms and verbally through story-telling and ad campaigns—driven by disgust instead of fascination.

Designers have the capacity to design with waste instead of against it, enabling the diversity of waste conditions to become an impetus for uncovering new, hybrid programmatic relationships (such as energy production and recreation) that intentionally register its visible characteristics—a landscape lifecycles approach. Rather than avoiding their challenging conditions, waste landscapes must be embraced as opportunities for creating productive relationships with waste as a common ground through enhancing legibility, forming hybrid assemblages in the transformation of perceived physical and spatial wastes.


Acknowledgements

The ongoing research presented in this article has been generously funded by the Penny White Travel Fellowship from Harvard University Graduate School of Design and the Layman Seed Award from the University of Nebraska-Lincoln. I am indebted to everyone I have met and interviewed in Iceland over the last decade, especially Magnea Gudmundsdóttir, who provided me with a tour of the Blue Lagoon, and Hronn Arnardóttir, who provided me with information about the Blue Lagoon’s research and development.


Catherine De Almeida is an Assistant Professor of Landscape Architecture at the University of Washington. Trained as a landscape architect and building architect, her research examines the materiality and performance of waste landscapes through exploratory methods in design research and practice. Catherine received her MLA from Harvard University and her BARCH from Pratt Institute. She is a certified remote drone pilot, an Honorary Member of the Tau Sigma Delta Honor Society in Architecture and Allied Arts, and a Fellow of the Center for Great Plains Studies. Her landscape lifecycles work has been supported by numerous grants, and recognized in national and international publications and media outlets, including the Landscape Research Record, Journal of Landscape Architecture, and Journal of Architectural Education.


Notes

[1] Orkustofnun, “Geothermal Development and Research in Iceland,” February 2010, accessed May 24, 2019, https://nea.is/media/utgafa/GD_loka.pdf, 14-16.

[2] Albert Albertsson, “Glimpse of the History of Hitaveita Sudurnesja Ltd: The Resource Park Concept,” United Nations University 30th Anniversary Workshop (2008), 1–8: 2.

[3] Ibid.

[4] Magnea Gudmundsdóttir, Ása Brynjólfsdóttir, and Albert Albertsson, “History of the Blue Lagoon in Svartsengi,” Proceedings World Geothermal Congress 2010, Bali, Indonesia (April 2010), accessed May 24, 2019, https://pdfs.semanticscholar.org/2cb3/0a8cd00f2d1a0046bc81bf93354dc62a9fad.pdf, 1–6:1.

[5] Catherine De Almeida, “Performative by-products: The emergence of waste reuse strategies at the Blue Lagoon,” Journal of Landscape Architecture 13, no. 3 (2018), 64-77: 67, https://doi.org/10.1080/18626033.2018.1589142.

[6] Ibid.

[7] Blue Lagoon Ltd. (2016), Blue Lagoon Press Kit, pp. 1-5, 1.

[8] Gudmundsdóttir Brynjólfsdóttir, and Albertsson, “History of the Blue Lagoon,” 3; Albertsson, “Glimpse of the History,” 5.

[9] Gudmundsdóttir, Brynjólfsdóttir, and Albertsson, “History of the Blue Lagoon”.

[10] Hronn Arnardottir, R&D Specialist at the Blue Lagoon R&D Center, Interviewed by author, Blue Lagoon, Iceland, July 2018.


Cite

Catherine De Almeida, “The Blue Lagoon: From Waste Commons to Landscape Commodity,” Scenario Journal 07: Power, December 2019, https://scenariojournal.com/article/blue-lagoon/.


Territory Of Extraction: The Crude North

For over a century, global discovery and consumption of crude oil rose steadily, with increasing demand mirrored by increasing potential supply. Then, in the 1970s the world experienced what many at the time considered “peak oil,” at which point fossil fuel demands continued to rise while production volumes of the world’s oil leveled off and began to decline [1, 2]. While production eventually recovered from the 1970s “peak,” over the upcoming decades conventional oil production is projected to continue its downward trend while consumption is predicted to continue on its upward trajectory for at least a decade and maybe more, despite the international commitments made in Paris [3] (Figure 1). With the readily accessible fossil fuel resources in decline, how will future global energy demands be met? Many countries that border the Arctic isotherm believe that the answer lies beneath the waters at their coastlines, where a large portion of the world’s remaining oil reserves are located.

In the United States, like the rest of the world, the declining hydrocarbon industry is vitally dependent on transportation infrastructure to move resources. Hundreds of miles of lands are cleared with the express purpose of building roadways and pipelines to transfer oil and gas from drill sites to refineries, then further down the supply chain to distribution nodes. Pipelines make distant resources attainable, while simultaneously turning mere wilderness into territory, projecting the power of the state across vast and sparsely settled territories for the purpose of extraction. Few places have had as much of their identity and economic history tied to the creation of a single piece of pipeline infrastructure as Alaska. The Trans-Alaska Pipeline radically transformed the economy of Alaska, both during the boom that accompanied its construction, and the subsequent massive infusion of revenue that oil production has injected into the state every year since.


Figure 1. World Oil Discoveries. A graph of discovered oil reserves juxtaposed against past and an approximation of projected production volumes (‘The Hubbert Curve’). All images by Michael W. Smith


In this moment of climate crisis, however, what does the future of Alaska’s relationship to its pipeline, and to the places fueling the hydrocarbon economy, look like? Can this single-use infrastructure be turned into a mechanism to usher in a renewable future for Alaska, and to function as a device that might help support the economy of the places that it formerly bypassed?

The Crude North is an exploration into uncertain trajectory of Alaska’s energy future through the manipulation of policy and infrastructure easements along the Trans-Alaska pipeline. The heart of this design investigation focuses on transforming the single-use infrastructure of the pipeline itself into a mechanism that can support local economic development and ultimately lead to a sustainable future economy.

 Figure 2. U.S. Crude Oil Field Production & Oil Rig Deployment. This shows the volume of oil production and the increased rig deployments across oil fields to satisfy consumption demands.


Hydrocarbon Territory 

Despite having some of the largest oil reserves in the world, America’s continental oil fields are slowing down and drying up. US oil production has been prolific since the early 1900s; the contiguous United States holds an estimated total of 24 billion barrels of oil (BBO) and 750 trillion cubic feet of gas (TCF) in underground reserves [4]. However, the reality is that until the fracking boom of the last decade, the country’s crude oil resources have been in steady decline since the 70s [5]. In the last decade, the number of oil rigs put into use across U.S. shale formations has increased exponentially as riggers try to extract as much oil as possible from dwindling reserves (Figure 2 & 3). The American Association of Petroleum Geologists acknowledges that the United States is “preeminent among nations in the manufacturing of oil well machinery and apparatus” [6]. Contemporary oil drilling machines have the ability to burrow horizontally under the earth to find pockets of formerly inaccessible “tight oil” between strata [7]. These drilling strategies yield temporary increase in supply all the while depleting remaining finite resources at an accelerated rate. Despite advances in drilling technology and extensive financial interest in oil and gas infrastructure in the lower 48, with its estimated remaining resources declining, the United States oil industry must look elsewhere for future energy resources.

Figure 3. North American Fossil Fuel Atlas. The North Slope of Alaska has hydrocarbon reserves rivaling the total volumes of the lower 48 states. The increasing access to extracting these resources is putting increased pressure on Alaska.


In 1968, a concentrated untapped volume of hydrocarbons was discovered off the coast of Alaska that rivals the total remaining resources in the rest of the country. An estimated 27 BBO of oil and 132 TCF of gas is located a few miles off the north coast of Alaska in relatively shallow US territorial waters [8] — more oil than is estimated beneath all oil reserves of the lower 48 states combined. Though abundant, extraction of this offshore oil is challenging, as it is disconnected from major refineries and markets.

Climate is a major consideration that has significant impacts on any industrial process in the Arctic. On Alaska’s North Slope winter temperatures commonly drop below 30°F and daylight lasts as little as 2 hours per day around the winter solstice. Between the low light availability, harsh winter temperatures and the encroaching sea ice, oil operations are limited for nearly half the year, resulting in harsh working conditions and seasonal employment.

Despite these challenges, technically speaking, drilling for hydrocarbons in Alaska’s shallow seas is one of the few positives for the oil industry. North Slope extraction is significantly less resource-intensive than in deeper waters such as the Gulf of Mexico. The geological construct of the North Slope continental shelf is less complex, and the depth of the seafloor is only 150 feet deep on average compared the Gulf’s 5000 feet [9]. The subsurface pressures in the North Slope are also relatively low compared to typical offshore wells, making extraction theoretically safer [10].

In recent years, an erosion in both the thickness and extent of sea ice, combined with various and technological innovations, are making the extraction of oil more alluring to governments and private companies. This phenomenon can be partially attributed to climate change — increasing seasonal access to the seafloor as well as longer accessibility to navigable waterways is making drilling for oil here much more financially appealing — a trend that will only intensify as Arctic sea ice continues to melt.

Figure 4. The Race for Arctic Hydrocarbons. There are over 30 significant hydrocarbon basins in the Arctic with varying amounts of natural gas and crude oil. Of these discovered basins, 25 have substantial reserves available for extraction [12].


The Crude North is an investigation of potential scenarios related to the future of crude oil extraction across this territory. Today, we find settlements clustered around pipeline pumping stations and depots that began as hubs dating back to the Trans-Alaska pipeline’s construction. Pipeline segments between settlements and abandoned construction camps are in need of repair as a result of shifting permafrost zones and aging infrastructure. The Crude North project reimagines the Trans-Alaskan Pipeline as an energy armature that might be expanded to accommodate future oil and gas extraction while simultaneously providing a more economically and environmentally sustainable future for the state.

No territory in the United States exhibits a bigger tension between resource extraction and conservation of public lands than the North Slope of Alaska.  The U.S. government has endorsed drilling off Alaska’s North Slope since 2015 [13]. Since the early 2000’s Alaskan Native groups have largely endorsed the oil and gas exploration there, advocating for job creation and economic development [14]; however, other indigenous groups like the Gwich’in, who subsist on Caribou hunting, have fiercely fought oil development in the North Slope. The indigenous populations of the North Slope don’t have the technical skills to compete with foreign engineers in providing labor for the extraction process. Alaskans need a sustainable solution to support the local economy during the next oil boom and to continue to thrive after post-peak production.

This project assumes that some North Shore oil extraction will take place regardless of current political and environmental pressures. If this prediction is valid, how then, should this extraction process be orchestrated, with deference to environmental considerations while finding a way to support the energy and economic needs of the community when the oil stops flowing? Alaska has an opportunity to leverage what is left of its hydrocarbon resources to support the subsequent energy infrastructure and do it in a way that prevents the cyclical boom and bust cycle associated with energy extraction.

Figure 5. Crude Oil & Coal Deposits in the U.S. Arctic Territory. The oil reserves off Alaska’s coastlines are adjacent to the north end of the Trans-Alaska Pipeline. This existing oil infrastructure and its right-of-way has the capacity to endure the burden of future oil extraction from North America’s Arctic basins.


BOOM and BUST

To understand how future oil development might play out after the coming oil boom on the North Slope, we can look back towards what has happened in Alaska’s past: in previous boom-bust cycles the population in Alaska has grown and shrunk in response to activity in the state’s oil plays [15]. In the 1970s migrant workers were deployed across Alaska’s landscape to build the Trans-Alaska Pipeline, a phenomenon that effectively doubled the state’s population at that time. After peak oil, the population rapidly fell, leaving behind abandoned infrastructure and an unstable economy. The onshore oil industry at the North Slope today buttresses the state’s revenues, but currently, onshore oil revenues are declining due to the reduction of onshore oil and gas field production. Like many of America’s oil wells over the past century, the wells here in Alaska are also drying up. The Trans-Alaska pipeline that once supplied America with between 20% and 25% of its crude oil is now flowing at approximately 1/3 the volume [16].

The onshore oil industry of the North Slope Borough has historically contributed up to 80% of Alaska’s unrestricted state revenues through taxes on oil infrastructure [17]. Currently, these onshore oil revenues are declining due to the reduction of onshore oil and gas field production. Like many of America’s early wells, Alaska’s wells are drying up [18].

But the offshore development in the North Slope is set to change this dynamic, and usher in a new boom. Alaska is once again about to experience a large and expeditious increase in population because of the impending petroleum extraction in the Arctic. The peak oil extraction in northern Alaskan seas are expected to take place in approximately 15 to 20 years [19]. The current baseline population predictions in Alaska are expected to naturally rise from 714,142 to 915,211 (a 13% increase) [20]. This estimate does not include projections related to the rapid expansion of the petroleum industry. Based on previous fluctuations related to hydrocarbon extraction here and to evaluated reserves, we can estimate that the increase may be 2-5 times larger than current projections. A portion of this population, however, will be transient and temporary. How can population growth projections alter the way we think about installing and positioning future oil?

Figure 6. Alaska Oil Migration/ Future Offshore Oil Boom. Alaska has seen massive migratory shifts with the ebb and flow of the oil industry. Because of this clear documentation in the past It’s easy to predict how this will play out across the next oil epoch. 


The Pipeline

When built, the extracted hydrocarbons will travel along the proposed Keystone XL pipeline. Various proposals suggest that the 48” diameter pipeline shall run adjacent to the Trans-Alaska pipeline from Prudhoe Bay, connecting to the Trans-Canada pipeline in Southwestern Yukon [21]. The 1,179 miles of pipeline would bridge the offshore North American basins and the oil fields in Alberta to the refineries in the United States. The pipeline is associated with a 100-foot right-of-way, the creation of which involves cutting and clearing of hundreds of acres of forest under the jurisdiction of the Bureau of Land Management (BLM) [22].

To facilitate the future hydrocarbon operations off the North Slope, the Keystone pipeline will be built directly adjacent to the Trans-Alaska pipeline, reactivating the dormant camps that previously provided a base of operations for the Trans-Alaska pipeline workers [23] (Figure 10). Today many of these stations are abandoned. Reactivating these sites, which are linked by transportation infrastructure, is an opportunity to couple existing infrastructure with new program that can breathe life back into an antiquated practice. This coupling can take shape in several forms that, if executed properly, holds the potential to create an economically viable future for this region.

In order to investigate a series of practical outcomes from anticipated extraction operations, The Crude North imagines several scenarios to evaluate some anticipated futures, testing three different plausible directions that Alaska can pursue to manage this imminent influx of resources, population and infrastructure. These studies ultimately lead to a hybridized approach.


Figure 7. Trans-Alaska Construction Camps. The Trans-Alaska pipeline traverses vastly different types of terrain and environments across it’s 800-mile stretch. These are snapshots of the 20 construction camps used to house workers and equipment during its construction.


Scenario 1: Maximized Extraction

The first scenario envisions maximum extraction on the North Slope (Figure 11). In this scenario, offshore operations would proceed during the summer while avoiding the most critical ecological zones. The long winter gap in oil operation presents a potential to use the network of utilities and easements along the Trans-Alaska pipeline to employ workers and activate the pipeline infrastructure network all year. During off-peak hours workers deploy along the pipeline to camp sites and repair the infrastructure before building new Keystone oil and gas pipelines adjacent to the Trans-Alaska infrastructure, connecting the North Slope to the lower 48 states.

The Shell Oil company has previously agreed to invest 7 billion dollars into installing the infrastructure required to support the growth of the local oil industry [24].  Over the next 30 years the oil that flows through the pipeline would increase to approximately 40,000 BBO per year [25].

To ensure safe and efficient offshore operations a large port or series of ports would certainly be installed. The ports will house mobile oil vessels, transportation vehicles, deployable oil spill vehicles and other rescue-operation related vehicles. After peak oil and towards the end of the offshore oil boom, drilling platforms will start to become obsolete and abandoned; other onshore and offshore infrastructure will become unused and inefficient. If left uncared for, temporary housing built to support workers will become vacant and derelict. With no alternative industry available to support them, the construction camps from the oil boom would also turn into ghost towns.

There is significant pressure from climate activists to prevent unrestrained fossil fuel extraction. The ‘keep it in the ground movement’ has growing international momentum, and scientists argue that the extraction and burning of Arctic oil reserves is incompatible with preventing a 2 degree Celsius rise in global temperature [26], the ‘upper limit of present day natural variability’ that would mark a shift into a new extreme climate regime, with significant increases in heatwaves, sea level rise, and coral bleaching [27, 28]. This political pressure is making the prospect of an aggressive extraction strategy increasingly unlikely.

Figure 8. Scenario 1: Maximized Extraction in the North Slope. This is how future extraction could play out if fossil fuel extraction were given priority over other competing interests.


Scenario 2: Ecological Economy

An alternative scenario to the typical extraction process could involve the promotion of a diversified economy that would be seeded during this period of off-peak extraction, ultimately replacing crude oil as a mechanism of economic development. It positions easement rights of the future pipeline infrastructure as a bargaining chip to allocate resources for developing Alaska’s primary resource: immense and relatively untrammeled areas of natural beauty.

Tourism remains a large attractor and a significant part of the Alaskan economy. The tourism industry brings in around 850,000 visitors annually [29]. The expansion of Arctic drilling, if managed strategically, could help unlock a new tourism market. Today the tourism provides “over 36,000 direct and indirect jobs and accounts for 8 percent of Alaska’s employment” [30]. Currently Alaska has the United States second largest outdoor sporting industry. Primarily during the spring and summer months tourists come to hunt, fish, hike, bird watch, raft, ski, camp and dog sled in the wild (Figure 12). The Hana Shoal, an ecologically sensitive marine environment right at the heart of a major Alaskan offshore hydrocarbon site in the Chukchi Sea, is host to millions of organisms including snow crabs, clams and fish. Many large mammals also live off the northern coast of Alaska, including seals, walruses and many species of whales. Local residents can profit from tourism to areas like the Hanna Shoal while also bringing awareness of these ecological hotspots.

Beginning on the coast of the North Slope, alongside the future pipeline, new and previously dormant infrastructure can be cultivated to create a spine for recreation and production run by local and Native residents. Reestablishing the unused pipeline camps as tourism hubs can be a viable first step in encouraging economic growth and give additional agency to the ecologically sensitive sites such as the Arctic National Wildlife Refuge (ANWR). Tourism adjacent to ANWR would help protect crude oil extraction from mutilating the protected land and prevent habitat loss along the Arctic shoreline while bringing more awareness to the social and environmental concerns of Alaska’s fragile ecosystems. Some fossil fuel development is allowed, but rather than riding a boom-to-bust trajectory, it sets up a long-term non-extraction-based economy.

Figure 9. Scenario 2: Ecological Economy. The investigation explores using existing easements along the Trans-Alaska highway and pipeline to support the transient populations of both workers and tourists.


Scenario 3: Extreme Climate Change

A third scenario engages with the possibility of extreme climate change and its potential effects on the hydrocarbon extraction industry and related ecological impacts to this region. Because of the physical footprint necessary to support extraction infrastructure, encroachment on federal lands & protected areas, as well as the effects of climate change, habitat loss is inevitable both onshore and offshore. At the same time, as global warming continues to thaw the Arctic, previously inaccessible waterways become navigable, allowing oil to be transported to global markets more quickly and cheaply than is currently possible [31] (Figure 13). The Alaskan permafrost retreats hundreds of miles to the south by 2050 [32], with Alaska’s active layer continuing to defrost until permafrost ponds remain thawed year-round.

The Trans-Alaska pipeline armature incentivizes development through the provision of basic services such as water, electricity and transportation. A warming North Slope also means increased access to Alaska’s previously remote natural and ecological resources. All this, combined with the low cost of living here, leads to significant population increases. If climate change progresses as projections suggest, how will the state and local government respond to the pressure of rapid population growth?

Figure 10. Scenario 3: Extreme Climate Change. This scenario looks at the potential future of the oil industry with extreme climate change. Recent science suggests these “extreme” scenarios are not actually that unlikely, and the Artic is changing faster than previously expected.


Diversifying Energy Infrastructure

To become resilient to a post-peak oil bust Alaska must respond to and employ elements of all three scenarios. If Alaska were to inject the vacant base camps along the Trans-Alaska pipeline with programs that supports the present-day oil industry, while building infrastructure in the offseason for future renewable energy sources and the underserved ecological tourism economy, the latter could emerge to succeed oil industry in economic support. Coupling the single-use infrastructure of the pipeline with alternative program and future clean energy provides the bones for establishing an economy that will live alongside the infrastructure footprint and diversify the local economy. These underlying systems can become the agents for an ecotourism network that has the potential to provide support and stabilize Alaska’s post peak oil economy.

Alaska will require more support that what ecotourism alone can contribute to the welfare of the state. Alaska has vast renewable energy resources that, if harnessed, have the potential to supersede the hydrocarbon industry. Because of the limited offshore extraction season the workers can operate for half of the year. During this other half of the year the oil workers can find employment supporting the alternative energy industries south of the North Slope where daylight and temperatures provide an opportunity for work (Figure 14). Coupling the hydrocarbon energy infrastructure with renewable energy resources will ensure that future energy and the state’s economic demands are satisfied after peak oil.

Figure 11. A Sustainable Scenario. This is an investigation of how the multiple use mandate on federal lands can aid in providing a sustainable future for Alaska.


The largest state in the United States, Alaska, has the third smallest population while using the third most energy. This can largely be attributed to the high energy use in harsh winters and the state’s energy-intensive industries [33]. Like the rest of the world, today Alaska primarily relies on fossil fuels for its energy needs even though the state has enough renewable energy resources available to displace the state’s current fossil fuel consumption volume [34] (Figure 15). Solar, biomass and wind energy sources possess the most potential for renewable energy production here. Because of the state’s large land area and small population, the potential for large-scale renewables is enormous.

61% of Alaska’s 364.5 million acres are federal public lands, with a mandate that enables extraction of resources for public benefit. Alaska’s public lands carry the potential to produce over 9,000,000 GHw of renewable energy [35]. This is enough clean energy to supply power for the state’s entire energy expenditure.

Figure 12. Alaska’s Renewable Energy Potential. The state of Alaska has a very high energy demand despite having a low population. The majority of these demands are met with fossil fuel consumption; however, the renewable energy potential here is enough to satisfy the state’s energy use.


Reimagining the Camp

Fairbanks is the 8th camp along the pipeline from the southernmost point. This camp, like the other 20, is currently abandoned but has utility hookups and basic infrastructures. The Fairbanks site is located near a large town and surrounded by Bureau of Land Management and Fish and Wildlife lands. Within these adjacent federal lands there is a large potential for solar and biomass energy production. To prepare this site for renewable operations construction can begin by building a transformation station to tie the future solar farm and other future energy sources into the U.S. electrical grid. In addition to the creation of solar fields, the clearing and seeding for a biomass farm will provide the resources for future renewable extraction at Fairbanks. Simultaneous with the construction of the energy hubs all 20 Trans-Alaskan pipeline camps could be renovated to accommodate regional tourism. Each construction camp can act as a nucleus, serving as the base for local activities and/or renewable energy production. By 2050 when the offshore oil resources begin to dry up the renewable energy systems can be fully operable and deeply embedded in local ecotourism operations. Around the main Fairbanks Camp several camp clusters can be installed to extend the tourism network laterally into the public lands.

The Coldfoot Camp is 200 miles North of Fairbanks and is positioned at the intersection of fertile ground and the present-day continuous permafrost zone. This is a strategic location for the Trans-Alaska operations because beyond this node Dalton Highway, the supply road for the pipeline system, becomes dangerous – especially during the winter months. The existing airfield here serves as a temporary base and transports supplies to Deadhorse, the terminus of the infrastructure at the Arctic Ocean. When offshore oil operations begin the State can take advantage of the high onshore wind potentials around Coldfoot. Building out the wind farm will take several years to complete; Both, during and after the installation of the turbines the pathways created to construct the renewable energy machines can be utilized as routes for tourists looking to hike, bike, hunt and explore the Alaskan wilderness. The trails created for the turbines, typically along the ridges of Brooks Range, can also host satellite camps for tourists.

Prudhoe Bay is the last stop along the Trans-Alaska infrastructure terminating at the shore of the North Slope. At this location where the North Slope meets the Arctic Ocean. In the coming years the offshore hydrocarbon extraction is expected to begin off the coast of the North Slope near the Hanna Shoal. Establishing access for tourism here will help protect the most sensitive ecological zones by providing advocacy through exposure. After the hydrocarbon industry’s operations recede, parallel with the continuous Arctic ice melt, tourism operations can expand by taking advantage of the increased water navigability during peak tourist season and the increased availability of the hydrocarbon operations infrastructure. Wind farms can begin to occupy the territories in the high wind zones off the coast and tie-in to the electrical grid. Between the permafrost ponds near the shores of the Beaufort Sea architectural structures can be installed to serve as basecamps for recreational activities. Temporary worker housing installed to house the seasonal workers of the oil industry can be repurposed for use by tourism operations.


Figure 13. Alaska Oil Migration/ Old Dormant Trans-Alaska Pipeline Construction Camps. The widely abandoned camps have existing resources such as airplane runways, shelters, power and water.


Critically evaluating Alaska’s future potential before construction begins on the Keystone Pipeline and leases are given in the offshore oil fields is paramount for creating a sustainable future for the state. This provocation — converting the future of the pipeline’s infrastructure from a single-use infrastructure into an armature that intertwines service and extraction with recreation and access, is an attempt to deliver more than a good-natured design proposal; it is a vast, high-impact design strategy for a resilient future. This goal will be achieved by introducing renewable practices that will be built to supersede the archaic energy methods of the fossil era and enables the construction of new landscapes that services both the public and private industry. In this way the capital interests can be satisfied but also leveraged to serve the needs of the public (Figure 16). Over the next 40 years as the oil industry moves beyond peak extraction, biomass, solar, onshore and offshore wind energy development can grow to a level that can sustain Alaska’s population growth and contribute to the energy grid of the lower 48 states.

Figure 14. A New Trans-Alaskan Armature. This provocation proposes adding a few strategic resources to the existing camps which take advantage of the adjacent federal lands and their natural resources. Key construction camps would double as renewable energy hubs providing jobs and the foundation for a sustainable future.


Michael W. Smith is a senior landscape architect at Landscape Architecture Bureau in Washington, D.C. where he has overseen several projects including the DHS Access Road Ecotones research and infrastructure project, the LeDroit Park Green Infrastructure Project, Marvin Gaye Trail, Phase I of the District Wharf, and Ingleside at Rock Creek’s community campus redevelopment. Michael’s work uses the built environment as a laboratory to investigate infrastructure networks and their relationships to the contemporary surrounding environment. Outside of professional practice Michael works on landscape research projects that aim to develop a better understanding of the benefits of landscape architecture at the local and regional scales. The threads of Michael’s professional work and research can be summarized as the systematic deconstruction of infrastructure lines and urban systems to evaluate, understand and improve them while developing strategies which support habitat and benefit the surrounding communities. This fall, he is instructing a design studio at Virginia Tech’s Washington-Alexandria Architecture Center.


References

[1] Serkine, Pierre. Peak Oil: Assessment, Critique of the Current Solutions, and Proposition of Alternatives. Bruges: College of Europe, 2013.

[2] Campbell, C. J. Oil Depletion –The Heart of the Matter,” prepared for The association for the Study of Peak Oil and Gas by Rocky Mountain Institute, Reinventing Fire, Chelsea Green. http://www.energycrisis.com/campbell/TheHeartOfTheMatter.pdf

[3] Smith, Grant. “IEA predicts global oil demand will level off around 2030.” World Oil. November 13, 2019. https://www.worldoil.com/news/2019/11/13/iea-predicts-global-oil-demand-will-level-off-around-2030.

[4] U.S. Energy Information Administration. “Review of Emerging Resources: U.S. Shale Gas and Shale Oil Plays.” Washington D.C.: U.S. Energy Information Administration, July 2011. https://www.eia.gov/analysis/studies/usshalegas/pdf/usshaleplays.pdf

[5] U.S. Energy Information Administration. “Lower 48 States Crude Oil Proved Reserves (Million Barrels).” Washington D.C.: U.S. Energy Information Administration, December 2019. https://www.eia.gov/dnav/pet/hist/LeafHandler.ashx?n=PET&s=RCRR01R48_1&f=A

[6] “The American Association of Petroleum Geologists.” Science 5, no. 1 (1921): 12. doi:10.1126/science.59.1514.12-a.

[7] Chauhan, M. S. Horizontal Drilling Engineering: Theory, Methods and Applications. Valley Cottage, NY: Scitus Academics, 2016.

[8] U.S. Bureau of Ocean Energy Management. “Assessment of Undiscovered Oil and Gas Resources of the Nation’s Outer Continental Shelf, 2016.” https://www.boem.gov/2016-National-Assessment-Fact-Sheet/

[9] “Why Shell Is Betting Billions to Drill for Oil in Alaska.” Fortune. Accessed April 21, 2019. http://fortune.com/2012/05/24/why-shell-is-betting-billions-to-drill-for-oil-in-alaska/.

[10] National Geographic Society. “Petroleum.” National Geographic Society. January 14, 2013. https://www.nationalgeographic.org/encyclopedia/petroleum/.

[11] Bird, Kenneth J. et al. “Circum-Arctic Resource Appraisal: Estimates of Undiscovered Oil and Gas North of the Arctic Circle.” United States Geological Survey, Fact Sheet 2008-3049. July 2008. http://pubs.usgs.gov/fs/2008/3049/fs2008-3049.pdf

[12] Ibid.

[13] Freking, Kevin. “Obama Administration Approves Arctic Drilling Ahead of President’s Visit to Alaska.” PBS. August 18, 2015. https://www.pbs.org/newshour/nation/approval-arctic-drilling-comes-just-obamas-visit.

[14] The Alaska Department of Labor and Workforce Development. “Gasline Workforce Plan.” International Energy Statistics. http://jobs.alaska.gov/energy/2018_Gasline_Workforce_Plan.pdf

[15] Alaska Department of Labor and Workforce Development, Research and Analysis Section. “Components of Population Change for Alaska, 1947-2019.” http://live.laborstats.alaska.gov/pop/estimates/data/ComponentsOfChangeGraph.pdf

[16] U.S. Energy Information Administration, Annual Crude oil Production, 42nd Series. April 30, 2019. http://www.eia.gov/dnav/pet/pet_crd_crpdn_adc_mbbl_a.htm

[17] Alaska Department of Revenue- Tax Division. “Fall 2018 Sources Revenue Book.”

[18] Fuchs, Walter. When the Oil Wells Run Dry. Dover, NH: Industrial Research Service, 1946.

[19] Joling, Dan. “Arctic Offshore Production Wells Approved off Alaska’s Coast.” AP NEWS. Associated Press, October 24, 2018. https://apnews.com/73e0b2c8f8854c5482f34af9f889b3dc.

[20] Alaska Department of Labor and Workforce Development, Alaska Population by Economic Region, Borough and Census Area: 2010 to 2035. April 16, 2012. http://labor.alaska.gov/news/2012/news12-26.pdf

[21] Avery, Samuel. The Pipeline and the Paradigm: Keystone XL, Tar Sands, and the Battle to Defuse the Carbon Bomb. Washington, DC: Ruka Press, 2013.

[22] Ibid.

[23] Ibid.

[24] Gilbert, Daniel and Sarah Kent. “Shell Places Huge Bet on Arctic Oil Riches,” The Wall Street Journal, July 7, 2015. https://www.wsj.com/articles/shell-places-huge-bet-on-arctic-oil-riches-1436311938

[25] King Economics Group, Alaska North Slope 10-Year Oil Production Forecast. November 19, 2018. https://kingeconomicsgroup.com/alaska-north-slope-10-year-oil-production-forecast/

[26] Mcglade, Christophe and Paul Ekins. “The Geographical Distribution of Fossil Fuels Unused When Limiting Global Warming to 2 °C.” Nature517, no. 7533 (January 8, 2015): 187–90. https://doi.org/10.1038/nature14016.

[27] “IPCC Special Report on the Impacts of Global Warming of 1.5 °C.” IPCC special report on the impacts of global warming of 1.5 °C. IPCC Bureau, October 5, 2018. https://www.ipcc.ch/sr15/.

[28] Schleussner, Carl-Friedrich et al. “Differential Climate Impacts for Policy-Relevant Limits to Global Warming: the Case of 1.5°and 2° C.” Earth System Dynamics 7, no. 2 (April 21, 2016): 327–51. https://doi.org/10.5194/esd-7-327-2016.

[29] Blazar, John. ‘Before Losing Yourself in the Vastness of Alaska, Be Prepared for Crowds : Wonders are there to enjoy, but the season is brief. To see the most, relax and rush less.” Los Angeles Times. July 7, 2015. https://www.latimes.com/archives/la-xpm-1992-06-14-tr-617-story.html

[30] Resource Development Council for Alaska, Inc. “Growing Alaska through responsible resource development.” 2011. https://www.akrdc.org/assets/docs/annualreport2011.pdf

[31] Wilson Center. “Opportunities and Challenges for Arctic Oil and Gas Development.” https://www.wilsoncenter.org/sites/default/files/Artic%20Report_F2.pdf

[32] Climate Change Impacts on the United States: Foundation Report. Cambridge: Cambridge University Press, 2001.

[33] U.S. Energy Information Administration. “Alaska State Profile and Energy Estimates.” November 15, 2018. https://www.eia.gov/state/?sid=AK

[34] National Renewable Energy Laboratory. “Renewable Energy in Alaska.” https://www.nrel.gov/docs/fy13osti/47176.pdf

[35] Ibid.


Infographic Sources

Figure 1. World Oil Discoveries

Data Source: Campbell,C.J.. ‘Oil Depletion – The Heart of the Matter.” The association for the Study of Peak Oil and Gas; Rocky Mountain Institute, Reinventing Fire, Chelsea Green.

Association for the Study of Peak Oil and Gas, “Peak Oil.”

Energy Information Administration, ‘U.S. Field Production of Crude Oil.”

The MacroStrategy Partnership LLP, “Absolute Return Oil Price.”

Figure 2. U.S. Crude Oil Field Production & Oil Rig Deployment

Data Source: Energy Information Administration, “U.S. Field Production of Crude Oil.”  

Energy Information Administration. “U.S. Crude Oil and Natural Gas Rotary Rigs in Operation.”

Figure 3. North American Fossil Fuel Atlas

Energy Information Administration,  “Layer Information for Interactive State Maps.” Energy Disruptions, Major Oil and Gas Plays, U.S. Energy mapping System. Using: ArcGIS [GIS software].

Energy Information Administration,  “Low permeability oil and gas play boundaries in Lower 48 States.” 3/11/2016. Using: ArcGIS [GIS software].

Energy Information Administration,  “Sedimentary basin boundaries in Lower 48 States.” March 11, 2016. Using: ArcGIS [GIS software].

Energy Information Administration,  “Marcellus play boundaries, structure and isopachs.” March 11, 2016. Using: ArcGIS [GIS software].

Energy Information Administration,  “Permian Basin: boundary, structure and tectonic features.” December 21, 2019. Using: ArcGIS [GIS software].

Energy Information Administration,  “Niobrara play boundaries, structure and isopachs.” March 11, 2016. Using: ArcGIS [GIS software].

Energy Information Administration,  “Eagle Ford play boundaries, structure and isopachs.” March 11, 2016. Using: ArcGIS [GIS software].

Energy Information Administration,  “Bakken and Three Forks play boundaries, structure and isopachs.” March 11, 2016.

Energy Information Administration,  “field boundaries (2007), resources (2006), reserves and production (2006), and top 100 methane emitting coal mines (2005). Using: ArcGIS [GIS software].

Figure 4. The Race for Arctic Hydrocarbons

U.S. Geological Survey, Central Energy Resource Team, “Map Service Showing Geology, Oil and Gas Fields, and Geologic Provinces of the Arctic. 2009. Using: ArcGIS [GIS software].

Figure 5. Crude Oil & Coal Deposits in the U.S. Arctic Territory

Energy Information Administration,  “field boundaries (2007), resources (2006), reserves and production (2006), and top 100 methane emitting coal mines (2005). Using: ArcGIS [GIS software].

U.S. Geological Survey, Central Energy Resource Team, “Map Service Showing Geology, Oil and Gas Fields, and Geologic Provinces of the Arctic. 2009. Using: ArcGIS [GIS software].

Figure 6. Alaska Oil Migration/ Future Offshore Oil Boom

Energy Information Administration, Alaska Field Production of Crude Oil; Alaska Department of Labor and Workforce Development, Research and Analysis Section, Components of Population Change for Alaska, 1947-2013.

Figure 7. Trans-Alaska Construction Camps

Google Earth, Trans Alaska Pipeline. Accessed March 1, 2014.

Figure 8. Scenario 1: North Slope Maximized Extraction

Energy Information Administration, Alaska Field Oil Production of Crude Oil. Using: ArcGIS [GIS software].

Figure 9. Scenario 2: Ecological Economy

Federal Lands of the United States. June 2005. Using: ArcGIS [GIS software].

Figure 10. Scenario 3: Extreme Climate Change

United States Geological Survey, Genetic and Climate Models; Trish  McAlaster, The Globe and Mail, Pewtrusts.org.

Figure 11. A Sustainable Scenario

Federal Lands of the United States. June 2005. Using: ArcGIS [GIS software].

Figure 12. Alaska’s Renewable Energy Potential

Energy Information Administration, Rankings: Total Energy Consumed per Capita; Census Bureau, 2010 Census. 

 National Renewable Energy Laboratory. Geospatial Data Science. Data Resources. Biomass, Geothermal, Hydrogen, Marine and Hydrokinetic, Solar and Wind Data. Using: ArcGIS [GIS software]. 

Figure 13. Alaska Oil Migration/ Old Dormant Trans-Alaska Pipeline Construction Camps.

Google Earth, Trans Alaska Pipeline. Accessed March 1, 2014.

Figure 14. A New Trans-Alaskan Armature

Google Earth, Trans Alaska Pipeline. Accessed March 1, 2014.


Cite

Michael W. Smith, “Territory of Extraction: The Crude North,” Scenario Journal 07: Power, December 2019, https://scenariojournal.com/article/crude-north/.


Daylighting Conflict: Board Games As Decision-Making Tools

A common rallying cry of the resilience movement is that change can be a win-win. Sometimes, it’s even a win-win-win. For a society to be capable of withstanding the catastrophic reach of climate change, the thinking goes, it must be retooled to absorb shocks and still keep operating. Achieving such elasticity would require big moves—reprogramming economic incentives, rewriting policy directives, investing in redundant infrastructures, and fostering diverse landscapes. The ability to absorb risk and not just deflect it promises to turn a threat into its own solution—that is, a win.

For resilience proponents, rhetoric pulled from game theory serves as a tool for coalition building. It draws in skeptics with a language that echoes both the logic of economic growth inextricable from the term sustainability, and the compulsion common in neoliberal governance to quantify values like equity and environment as profits. The term win-win suggests there are no tradeoffs. Indeed, the promise of no-guilt multi-benefit solutions has succeeded in forging significant alliances across seemingly disconnected resources like energy or water and diverse interests like homeownership or migrancy [1]. And yet, the very risks these solutions hope to defuse were themselves the product of tradeoffs—what is climate change but a byproduct of the combustion engine as well as the policies and industries that leverage it?

The term win-win aspires to generate power for wholesale change using the language of business as usual. It reaches out from one interest group to another without translating its own jargon. In turn, its usage gives testimony for critiques long lobbied against resilience—namely, that it requires the most vulnerable to absorb risk without challenging the disinvestment and exclusion that made them insecure in the first place [2]. The true power of resilience lies in its capacity to mobilize public spending, to affix risks in the public imagination, and to recognize that their reach extends across traditional disciplinary, ideological, and cultural boundaries. Still, meaningfully translating across camps and tapping the roots of structural inequities would require a more probing process of deliberation. Making more difficult decisions possible would require acknowledging that there are inevitably, deliberately, and regrettably losers—and have always been losers. Failure to daylight critical, and possibly generative, conflicts would sequester decision-making in smoke-filled rooms or, worse, leave these debates forgotten.

This article unpacks a series of board games I’ve created and produced over the past five years that expose the political contestations embroiled in climate risk. I’ve somewhat ironically titled the series Win-Win to acknowledge the “win-lose” and “lose-lose” end games also implied in climate-related futures thinking [3]. These games model relationships between sea level rise and social justice issues such as gentrification and displacement. They’re tools for engagement that prompt debate, acknowledge differences, and navigate their negotiation. Many of them were created in collaboration with government agencies and interdisciplinary partners for use in prompting discussion with constituents and provoking a more informed decision-making process. My aim is to demonstrate how games can unearth new sites of power and a recharged vision of inclusivity in the face of crisis.


In It Together

The Estuary Commons proposal by the All Bay Collective. This proposed network of tidal ponds, landforms, and expanded streams would enable cities surrounding the San Leandro Bay to adapt to sea level rise and groundwater flooding. Image by The All Bay Collective.


Resilient Equity Hubs (ReHBs) can ensure adaptation without displacement by supporting collective ownership of homes, businesses and natural resources. At a policy scale, value capture policies can leverage benefits from future infrastructural investments to collective and local initiatives. Image by The All Bay Collective.


The game In It Together was created for the Resilient by Design Bay Area Challenge (RBD), which was organized in 2017-18 by city and state agencies across the San Francisco Bay area and inspired by the Rebuild by Design challenge in New York and New Jersey after superstorm Sandy. Funded by the Rockefeller Foundation, RBD organizers selected 10 international teams to create design proposals that make the Bay Area more resilient to sea level rise and other climate-related risks. Our team was called the All Bay Collective, which combined expertise across architecture, landscape architecture, engineering, urban economics, housing policy, public advocacy, biology, film-making, and graphic design, among others [4]. We focused on combined groundwater and social justice challenges in San Leandro Bay, which connects Deep East Oakland with Alameda Island and the Oakland Airport. Our proposal, called “The Estuary Commons,” [5] developed strategies to share resources and space across landscapes, and among agencies and property owners.

The All Bay Collective with community-based partners in Deep East Oakland. Image by The All Bay Collective.


Project Working Group organization chart for The Estuary Commons. Image by The All Bay Collective.


We also worked closely with community-based organizations including the East Oakland Collective, Oakland Climate Action Coalition, Merritt College, and many others; as well as city and state agencies including the City of Oakland, East Bay Regional Parks District, and BART. The tight schedule of RBD left little time for fully developed collaboration with community partners already understandably reluctant to work with teams they did not themselves select. Still, our team was able to form trusting relationships by demonstrating that we weren’t interested in creating a single master plan—instead, our approach was to offer tools such as this game that neighborhood advocates could use.

Stakeholder cards completed by Project Working Group members from the design teams, community-based organizations and government agencies. Image: Janette Kim/Urban Works Agency with the All Bay Collective [left]. Project Working Group sketch. Image: Janette Kim/Urban Works Agency. Image by The All Bay Collective [right].


Marquita Price of the East Oakland Collective with Stephen Engblom of AECOM at the second Project Working Group meeting. Image by Janette Kim/Urban Works Agency with The All Bay Collective.


We created the game and design proposals in parallel so each step could inform each other. We began by handing stakeholders blank player cards on which we asked them to describe their priorities. We defined the character of the game’s players accordingly, and then worked with my students at the California College of the Arts (CCA) to brainstorm game design ideas. With this inspiration, we returned to the next stakeholder meeting with a proposal for a series of adaptation-oriented game pieces ranging from tidal ponds and living levees, to policies for affordable housing and community land trusts. Our partners used the map to redraw resources and sites in the neighborhood, and opened up a lively debate over which strategies would be most valuable. Some argued that large-scale infrastructural investments would only be possible with revenue-generating programs like a transit mega-hub or a tech campus for unicorn companies. Others argued for wealth-creation measures for the neighborhood’s mostly African American and Latinx residents through avenues towards land ownership and entrepreneurship. Between these two positions, others critiqued the flow of tax funding in Oakland that would bypass funds from any new investments out of the neighborhood. This opened up a complex bundle of challenges I’ll return to, but as an immediate response, we brought to the third meeting a new set of adaptation pieces reflecting these strategies. These including value-capture policies like a “Public Benefits Zone” which would help redirect income from future developments to support local initiatives.

In It Together draft version, overview. Image by Janette Kim/Urban Works Agency.


Draft adaptation pieces, showing flood control impacts in blue; parks, habitat creation, and transit impacts in green; job-creation impacts in yellow, and other social-justice impacts in red. Policies are applied with strings designating the boundary of an affected area. Image by Janette Kim/Urban Works Agency.


Through this process, we defined the game as a contest among seven players representing diverse stakeholder interests: East Oakland Residents, the City of Oakland, a neighboring bedroom community called Alameda, Developers, Airport, Utilities, and Wildlife. Each player is given a different set of unique goals, which they accomplish by placing adaptation pieces onto the board. To clarify the nature of their impact, the pieces are color coded according to four categories: ecology, economy, social justice, and governance. The City of Oakland, for example, must protect the city from sea level rise (among other goals), while the resident is more concerned with relatively short-term challenges of affordable housing and wealth creation. During one event, the airport player overcame the wildlife player’s protests to pass a policy barring nearby wetland creation to protect its runways from “bird strikes.” He did this in exchange for his donations to other players’ living levee investments.

During one game night event, the airport player, role-played by a California College of the Arts student, overcame the wildlife player’s protests to pass a policy barring nearby wetland creation to protect its runways from “bird strikes.” Image by Janette Kim/Urban Works Agency.


Resilience Abacus in the final In It Together version, showing collective improvements on environment in green, economic capacity in yellow, social-radial equity in red, and governance in orange. Image by Janette Kim/Urban Works Agency.


Player interests also overlap. The developer player, for example, wants to cultivate new landscapes to add value to his or her investments, which overlaps with the resident’s need to improve air quality, and the wildlife player’s need to create new habitat. Since one player’s moves can also score goals for the other players, there’s an incentive to negotiate, deflect, and pay close attention to others’ strategies. Each move also scores resilience points for the whole collective, tallied on an abacus at the corner of the board. Winning, in this sense, can be defined in a number of ways.

Living Levee Loop. Image by Sara Lafleur-Vetter for the All Bay Collective.


There are three possible outcomes to the game, any of which can occur at any time: in a win-lose scenario, one player completes his or her goals before the others do. In a lose-lose scenario, everything floods. And in a win-win scenario, all of the players win by scoring all possible resilience points. If players can convince each other to all pitch in, for example, they can to create a ‘living levee loop” that protects the whole bay from flooding. Despite this optimistic design feature, such coordination hasn’t always proved to be inclusive: in one event, the players passed a policy that forced the East Oakland Resident player to pay a tax for the living levee loop— a textbook demonstration of the tyranny of the majority. In other ways, though, players have also found enduring forms of cooperation. Once, all players pooled their coins together in the middle of the board, and purchased “public benefit zone” piece alongside a local solar farm. They won so much profit that they were able to protect the whole bay in one round, before sea level could even strike.

The Community Resilience Investment Decision Making Tool: a triple-bottom line style calculator expanded to include a fourth ‘bottom line’ of governance. Created by urban economist Paul Peninger at AECOM. Image by AECOM with The All Bay Collective.


We extended the question of what it means to win to encompass more analytic methods in urban planning. We developed the game in coordination with a triple bottom line-style calculator created by our teammate, the AECOM urban economist Paul Peninger. The tool’s name “Community Resilience Investment Decision Making Tool,” only serves to prove its bureaucratic utility [6]. It’s an excel file into which users can input adaptation measures they’d like to try, such as 1 mile of living levees or 5,000 housing units, and output a pie chart illustrating impacts according to various criteria. Triple-bottom line analysis is an accounting method that recognizes the benefits of a project based on its ecological and social equity impacts as well as its impact on the traditional bottom line, profit. We built on this and added a fourth category, governance, to signal the importance of local decision-making power. These criteria align with the Collective Resilience Points abacus in In It Together, and the color-coding of adaptation piece throughout the game, so ideas that emerge during game play can also tie directly to economic simulations at least partly closer to the ‘real world.’

Game play at the Higher Ground Leadership Workforce, an after-school program based at the Madison Park Academy Elementary School. Image by Sara Lafleur-Vetter for the All Bay Collective.


Game play at the Resilient by Design Exhibition and Storefront in San Francisco.


Game play at the East Oakland Collective. Image by Janette Kim/Urban Works Agency.


Game play with architecture students at California College of the Arts. Image by Janette Kim/Urban Works Agency.


During the last few months of RBD, I worked closely with the ABC team and East Oakland community partners to define player interests, adaptation pieces, and rules. We asked each other, for example, whether players should start out with the same amount of money. An East Oakland Collective (EOC) representative expressed that he was torn between wanting to reflect reality, and not wanting to feel burdened by the truth even during a process of play. We finalized the current iteration of the game [7] (in which players do get the same funds) in April 2018. Since then, CCA students have fabricated two copies of the game, and I’ve organized nearly 20 game play sessions with East Oakland activists, middle school students in a local after-school program, planners at sustainability and resilience conferences, at RBD events, with students in California College of the Arts’ Design MBA students and architecture programs, and with students from south and southeast Asia in a U.S. State Department program. We developed a “game show” style of play in which each player is represented by a group of people who negotiate amongst themselves as well as with each other, all while enjoying the drama of the game as one big group.

One of the stickiest points of contention among stakeholders involved in RBD was the relationship between development and gentrification, and the question of where the power to generate wealth stems from. Initial attempts to navigate these differences only magnified distrust, creating frictions that either pit voices against each other or left much unsaid. The opportunity to create community-owned solar installations, for example, was downplayed because the ability for community groups to profit from energy sales would compete with private utility companies. The game was helpful in this regard, as it kept debates live. The premise of the game encouraged people to exaggerate in their role play—a dynamic that was frequently highlighted in the swagger players adopted in playing the Mayor, who had to get re-elected in the second round. During game play at the East Oakland Collective, too, players not only anticipated how neighborhood empowerment works, but anticipated how competitive moves might open up. Players suggested altering the game to create “grant” cards that foster collaboration. Others suggested that the developer player might be able to lay claim on areas of the board for a cheap price, to better reflect the land speculation happening in the area. And, in the logic of game play, such aggressive strategies could also be flipped again, and used by all players. The game enabled players to switch perspectives, and suspend their judgement on whether an idea was in their camp or not. Instead, strategies were seen as creative play, not ideological posturing.

The game also brought strategies that tackle social justice into the same conversation as those that address hydrological issues; and found ways in which they overlay. Though it proved difficult to bring all of the issues raised in our stakeholder gatherings to the quantifiable logic of the triple bottom line calculator (issues like the wealth gap proved difficult to quantify), the game gave space for a kind of debate and judgement rare among diverse publics. It brought these issues into a site for deliberation in which these values could be meaningfully compared with some of the most dominant forms of analysis in decision-making.


Win-Win

Bartertown. A game of social resilience to climate change. Video credit: Janette Kim/Urban Works Agency with Alma Davila, on Vimeo.


Which power, and which tools matter most? Along with In It Together, all games in the Win-Win series remind us that design of every game is of course a political challenge in itself. This series of 5 games—some created by students and some created for clients—tests possible power arrangements, both utopian and dystopian. The Other 99% is a Monopoly-style real estate game, except that one player starts with three times the money than the others, who in turn have three times as many votes. In Flip This Hood, a “home team” of residents and an “away team” of stadium developers vie for the neighborhood through moves that include no-fault evictions and squatting. In Delirious D.C., players mimic the relocation of federal and local programs out of the flood zone. They slot program pieces like schools, stores, agencies and prisons into a Connect Four-style board, getting extra points for creating new institutions like the “detentucation,” as an ironic commentary on the school-to-prison pipeline, or the FBIRS, to envision a new federal agency [8]. Bartertown, [9] which I designed for the San Francisco Bay Area Conservation and Development Commission to use in their community outreach and interagency collaboration efforts, tests how social networks can be re-shaped by an economy of favors and resource-sharing.

These games tackle questions embedded in the very logic of board games. Where players in familiar household board games might range from the mouse in Mousetrap to secret identities in the game of Clue, Bartertown includes a player who can give others piggyback rides around the board. Where Monopoly has paper money, Bartertown offers benefits through a bread oven that might emit smoke puffs over this fictional land. Currency in the history of games has included pieces from 1941 French game The Trading Game, which taught children the value of colonial empires by gathering rice and cotton while dodging pitfalls like “laziness” and “intemperance.”  Games also define chance: the 1866 Checkered Game of Life can lead players to “Bravery,” “Fame,” and “College,” or “Gambling, Ruin,” or even “Suicide”–and curiously ends when you reach the “Happy Old Age” of 50. In turn, Bartertown imagines how alternate currencies like property, inventiveness, generosity, mobility and influence might exchange with each other. Taken together, these games model alternate rules for power-sharing for the larger world.


Models of Power

By designing interactions among players, objectives and resources, these games model the social justice implications of innovative financial and legal strategies. Equally important, they model the space of cities, offering unique ideas about the built environment in direct relationship to such dynamics. Together, these two interpretations of a ‘model’ serve as a new kind of decision-making tool for the climate change era: one that imagines new relationships among economies, publics and architectural design.

The construction of knowledge in a risk society demands better tools for deliberation—tools with which we imagine and debate the consequences, collective alliances, and, ultimately, the ethics embroiled within climate risk. Doing so would demand that we draw seemingly incommensurate values—from the fields of economics to biology, and across players, resources and environments—into a space of meaningful comparison.

Instead, a different kind of process would welcome in new players; exchange one form of currency for another; test the consequences, both kind and cruel; seek even the most difficult forms of cooperation, and most of all—embrace the surprising oddities that come out of this process. Ultimately, then, the kind of power so typically affiliated with financial and political capital can also be found at the most underrated sites—indeed, within forms of currency like generosity, inventiveness and flexibility.


Janette Kim is an architectural designer, researcher, and educator based in the San Francisco Bay Area. Her work focuses on design and ecology in relationship to public representation, interest, and debate. Janette is assistant professor of architecture and co-director of the Urban Works Agency at California College of the Arts, founding principal of the design practice All of the Above, and founding editor of ARPA Journal, a digital publication on applied research practices in architecture. Her projects include designs for the Oakland Coliseum neighborhood as part of the Resilient by Design Challenge, the Win-Win series of climate change board games, a boutique hotel in Sichuan, Safari tours on urban ecology, the Pinterest Headquarters, National AIDS Memorial, and the Fall Kill Creek Master Plan.

Janette has worked in partnership with municipal agencies such as the Metropolitan Transit Authority in New York and the City of Newark, as well as non-profit advocacy groups such as Hudson River Sloop Clearwater. Her work has been awarded by the Graham Foundation and the Van Alen Institute New York Prize Fellowship, and has been featured in NPR’s ‘Brian Lehrer Show,’ Artforum, Architect, Frame, GOOD, and the feature-length documentary, The Grove. Janette’s work has been exhibited in subway systems in New York, Beijing, Hong Kong, Shenzhen, and Sao Paulo; a private house in Levittown, NY; and galleries including Artists Space, Eyebeam and the Storefront for Art and Architecture.

Janette was also Assistant Professor at Syracuse University from 2015-2016 and Adjunct Assistant Professor from 2005-2015 at Columbia University, where she directed the Applied Research Practices in Architecture initiative and the Urban Landscape Lab. Janette holds a Masters of Architecture from Princeton University and a Bachelor of Arts from Columbia University.


Notes

[1] Resilient by Design, Bay Area Challenge,Ed. Zoe Siegel (Self-published, 2019). http://www.resilientbayarea.org/book

[2] Cedric Johnson, The Neoliberal Deluge: Hurricane Katrina, Late Capitalism, and the Remaking of New Orleans, (University of Minnesota Press, 2011) and “Hopeful Resilience,” Orit Halpern in in “Accumulation,” Ed. Daniel A. Barber, E-flux Architecture. April 2017. Accessed November 6, 2019. https://www.e-flux.com/architecture/accumulation/96421/hopeful-resilience/

[3] Urban Works Agency, “Win Win Board Games,” https://www.urbanworks.cca.edu/win-win-board-games.

[4]  In It Together was created by Janette Kim/Urban Works Agency and the All Bay Collective for the Resilient by Design Bay Area Challenge. The All Bay Collective team includes AECOM, CMG Landscape Architecture, UC Berkeley College of Environmental Design, and CCA (led by Janette Kim and Neeraj Bhatia), in association with Silverstrum Climate Associates, Skeo, Moll de Monchaux, and David Baker Architects. CCA student authors of the game are Shahad Alamoudi, Marwan Barmasood, Georgia Came, Denisse Correa Guerra, Ally Foronda, Eric Fura, Francisco Garcia, Jessica Grinaker, Fathmath Isha, Lori Martinez, Jennifer Pandian and Sabrina Schrader. Special acknowledgement to Claire Bonham-Carter, Kris May, Paul Peninger, Stephen Enbglom, Marquita Price and Greg Jackson for their involvement in developing the game. For more information see https://www.urbanworks.cca.edu/in-it-together,

[5] The All Bay Collective was comprised of AECOM, CMG Landscape Architecture, CCA Urban Works Agency, and UC Berkeley, with David Baker Architects, Silvestrum, Skeo, and Moll de Monchaux. The Urban Works Team was comprised of Janette Kim and Neeraj Bhatia with Liz Lessig, Cesar Lopez, Namhi Kwun and Carlos Serrano. Partnering community-based organizations consisted of East Oakland Collective, Oakland Climate Action Coalition, Scraper Bike Team, Merritt College Brower Dellums Institute for Sustainable Policy Studies, Planting Justice, HOPE Collaborative, East Oakland Building Health Communities, and Repaired Nations. Partnering government organizations consisted of Oakland Planning, the City of Alameda, BART, the Port of Oakland, East Bay Regional Park District, and EBMUD.

[6] The All Bay Collective, “Community Resilience Investment Decision Making Tool,” Resilient by Design. http://www.resilientbayarea.org/community-resilience-investment-tool

[7] In It Together is currently being revised for widespread publication by Room and Board Games.

[8] The Other 99% was created by Syracuse University students Shiyun Fan, Huaye Wei, and Seungah Lee in 2016 a seminar taught by Janette Kim. Delirious D.C. was created by students at Columbia University Mira De Avila-Shin and Galen Pardee in 2015 in a studio taught by Janette Kim. Flip This Hood was created by students at California College of the Arts Rachel (Quinn) Hammond and Sean Gentry in 2016 in a studio taught by Janette Kim.


Cite

Janette Kim, “Daylighting Conflict: Board Games as Decision-Making Tools,” Scenario Journal 07: Power, December 2019, https://scenariojournal.com/article/daylighting-conflict/