Introduction
Massive city tree planting campaigns have invigorated the urban forestry movement, and engaged politicians, planners, and the public in urban greening. Million tree initiatives have been launched in Los Angeles, CA; Denver, CO; New York City, NY; Philadelphia, PA, and other cities. Sacramento, CA even has a five million tree program. These planting campaigns – and urban forestry programs in general – are justified by models that estimate and monetize the environmental and socioeconomic benefits of trees [1,2]. These ecosystem services, defined as “the benefits that humans derive from nature,” play a major role in urban natural resource management [3,4].
However, realizing the ecosystem services associated with planting depends on tree survival. Despite the major focus on city tree planting over the past few decades, Nowak and Greenfield found that overall canopy cover levels in major US cities have been declining [5]. As these authors noted, “it is apparent that tree planting and natural regeneration are insufficient to offset the current losses.” With major new planting campaigns, how many of those trees will survive for decades, reaching a mature size at which their environmental and socioeconomic benefits are greatest? How many trees are enough – that is, how many need to be planted to make a lasting impact, and meet a city’s canopy cover goals? What are the implications of future tree death for managing the urban forest, in terms of cycles of tree removal and replacement? Answering these most basic questions in urban forest planning requires information about tree mortality and growth rates.
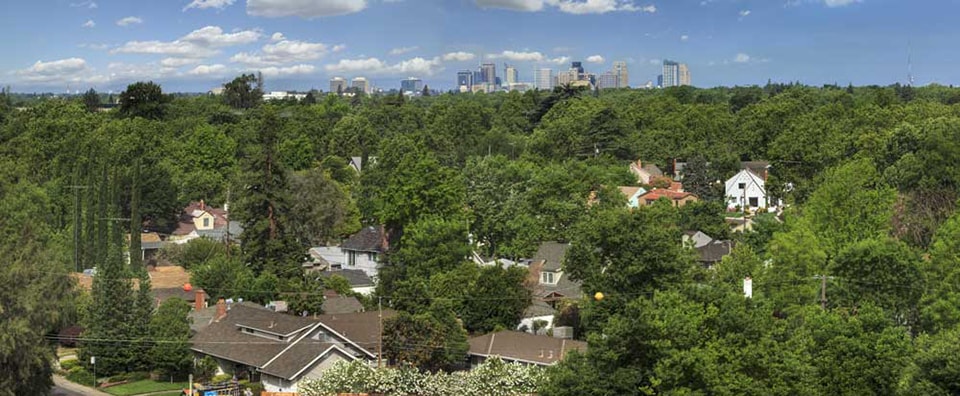
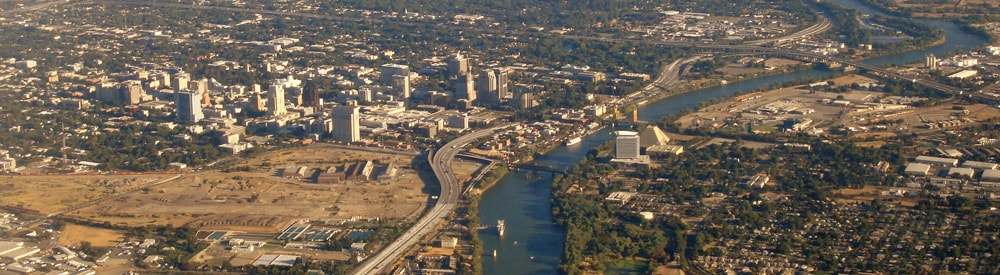
Figure 1. The urban forest canopy of Sacramento, CA in the spring. Image courtesy of the Sacramento Tree Foundation.
Unfortunately, long-term studies are sorely lacking for city trees. While cities rely on urban forest assessments, such as inventories and canopy cover analysis, to guide management, planning, and policy [6], long-term monitoring and associated mortality data are key missing pieces. Projected losses for the million tree campaigns demonstrate the importance of mortality data for estimating environmental benefits. The mortality rate patterns embedded within tree population projections for New York City [7] are based on a single study of maple street trees from Syracuse, NY [8], and survival scenarios for Los Angeles [9] do not cite any particular field studies. These and other authors have noted that mortality rates are a major source of uncertainty in predicting urban forest change over time. In the study about Los Angeles’ million tree program, a low mortality scenario projected that 17% of planted trees would be dead after 35 years, and a high mortality scenario projected 56% mortality.
These huge differences in mortality assumptions led to a large range in anticipated benefits: $1.95 billion to $1.33 billion in ecosystem services for the low and high mortality predictions, respectively. While mortality field data in Los Angeles has not yet been reported, we can compare the Los Angeles predictions to observations with MillionTreesNYC and the Sacramento Shade Tree program (Figure 1). For street trees in New York City, eight to nine years after planting, 26.2% were dead [10]. For a yard tree give-away program in Sacramento, five years after planting, 29.1% had died, on top of 15.1% that were never planted by residents [11] (Figure 2). For these yard and street tree examples, over a quarter of the trees planted died within the first five to nine years, and furthermore, for the tree give-away, some trees never made it into the ground. The Los Angeles low mortality scenario therefore appears overly optimistic.
While researchers have noted the importance of understanding mortality and generating long-term data, local practitioners have already started tracking the trees that they plant and manage [13]. Yet these practitioner-led efforts are somewhat isolated, and rarely documented in publications [14]. Journalists and bloggers have begun asking questions about tree survival in the massive planting campaigns as well, with article titles such as “A million trees? Only if we can keep them around” [15]. Given the call for monitoring the success of urban tree planting programs from the public, urban forest professionals, and researchers, the timing is ripe to finally embark on a nationally coordinated monitoring network. Towards this end, a new collaborative endeavor is underway to develop standardized tree monitoring protocols. By generating data that can be compared across cities and programs, we will enhance our ability to understand tree mortality rates and causes [16]. This kind of data can feed both academic and applied interests, from studying the biophysical and socioeconomic drivers of urban tree mortality, to recording tree survival as an indicator of local program success. While it will take years for us to produce the long-term data sets we seek, we can strive in the meantime to promote a common understanding of the role tree death plays in urban forest management.
In this essay, I discuss street tree mortality in terms of demographic concepts, and advocate for the application of these approaches in urban forest planning. Demography – the statistical study of populations – is used to analyze mortality trends and project future changes in systems ranging from human societies to endangered wildlife communities and natural forests. The same concepts and calculations used by actuaries (to determine risk of death for life insurance) and conservation biologists (to assess species extinction risk) can be used to study tree death in cities. While street trees do not encompass the entire urban forest, they are a major focus of tree planting and management operations, and are often the first line of public engagement with tree planting and stewardship. As we produce more long-term data in the years ahead, we will be able to compare different site types within the urban forest, such as streets, yards, and parks, and tailor population projections to the varied management regimes and species palettes within the urban forest landscape.
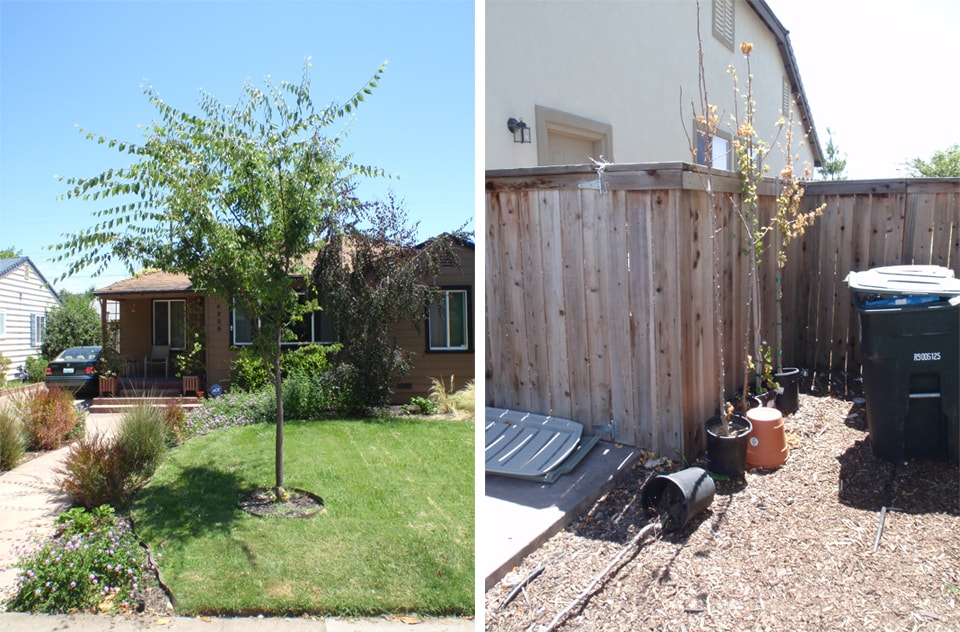
Figure 2. Yard tree survival in Sacramento County, CA from a tree give-away program: a tree that survived [left]; a vacant, foreclosed property where trees were never planted [right]. In this study, some trees were lost due to failure to plant, in addition to post-planting mortality [12]. Images © Lara Roman.
Street tree lifespans
A common notion heard among arborists and urban planners is that street trees live, on average, for seven years. This figure comes from a 25-year-old article stating that suburban trees have an average lifespan of 32 years, and street trees seven years [17]. A similar study published a few years later reported that downtown trees have an average lifespan of 13 years [18]. These numbers were based on a questionnaire sent to urban foresters across the US, asking the local experts to estimate the typical tree lifespans in their cities. However, the questionnaire-based figures should be replaced with field data for a more accurate representation of urban tree longevity. In the decades since those articles were published, several more studies have reported primary field data on street tree death, offering the opportunity to combine results. Based on my analysis of 11 previous studies, the typical street tree mean life expectancy is 19-28 years, and the annual mortality rate is 3.5-5.1% [19]. This is far longer than the seven or 13-year figures previously reported. In fact, if the mean life expectancy was truly seven years, annual mortality would be 13.3%, far higher than the rates reported in published studies. While the mortality scenarios in ecosystem services projection models might be overly optimistic, the seven-year lifespan idea appears to be overly pessimistic. For purposes of natural resources planning and ecosystem services models, we need realistic expectations based on observations, rather than overly optimistic or pessimistic speculations.
Additionally, mean life expectancy may not be the best metric for communicating about urban tree longevity and death. As the average lifespan across all individuals, the mean life expectancy becomes very high when just a few individuals reach old age. A term with more practical application to managers is the population half-life: the time by which half of the planted trees can be expected to die. With the typical street tree mortality rates of 3.5-5.1% mentioned above, the population half-life is 13-20 years [20] (Figure 3). In other words, for every 100 street trees that get planted, only 50 will make it to 13-20 years [21]. These field data on urban tree mortality suggest that as the number of trees originally planted die over time, community foresters have to keep replacing trees, year after year, to have any chance of increasing population counts and canopy cover.
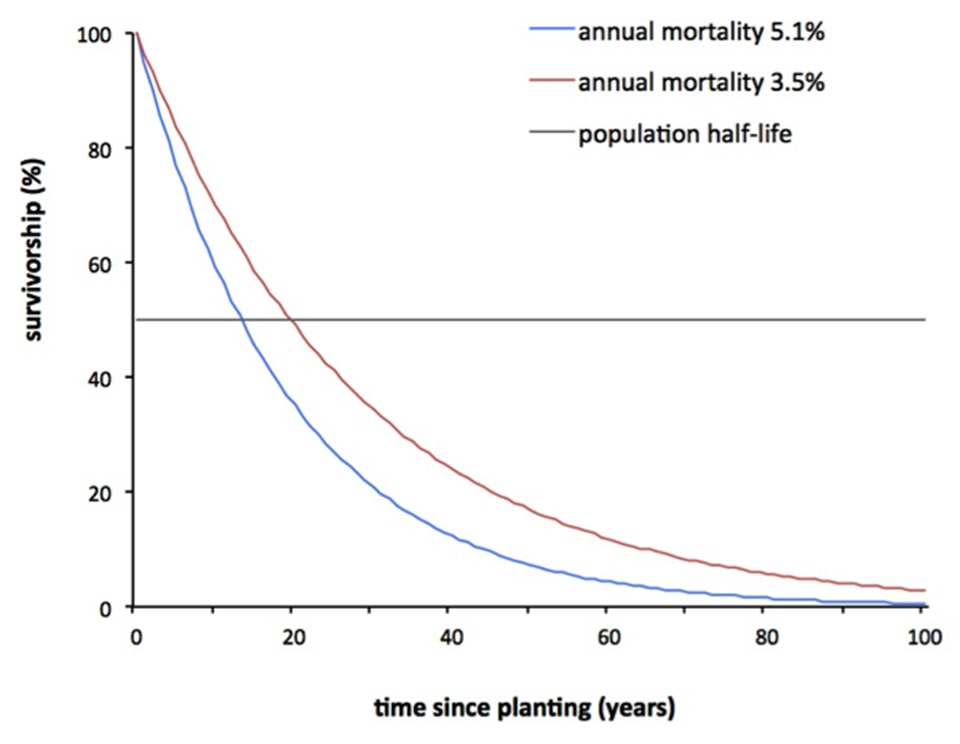
Figure 3. Survivorship curves with population half-life: Survivorship curves for street trees when annual mortality is constant at 5.1 or 3.5%, as estimated from a meta-analysis of previous studies, adapted from Roman and Scatena (2011) [22]. These curves depict exponential decay in cumulative survivorship. The population half-life is the time at which half the population has died (survivorship = 50%). Note that survivorship curves are often drawn in the demographic literature with log-transformation, but that this graph is not log-transformed for ease of interpretation.
Tracking population fluxes
To understand changes in urban forests over time, we need more than mortality data. Like any population, urban forests change through inputs and outputs to the system. In human and animal populations, those fluxes are birth, death, immigration, and emigration. In the urban forest, we have losses from mortality and removal, and inputs from planting and natural regeneration of seedlings. In the heavily managed street tree environment, natural regeneration is negligible, so the main source of new trees is planting [23]. This makes tree-lined streets more akin to an orchard: a cultivated landscape, stewarded by humans, and grown for human benefit.
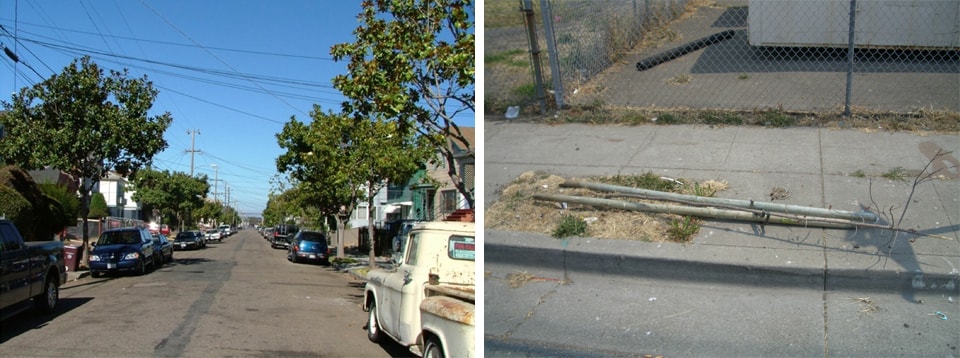
Figure 4. Street trees in the West Oakland neighborhood of Oakland, CA: a street lined with magnolia trees [left]; a dead young tree [right]. Images © Lara Roman.
An example of the fluxes in a street tree population comes from five years of annual monitoring in Oakland, CA [24]. The goal of this study was to understand net change in street tree population counts, in relation to annual planting and mortality (Figure 4). The West Oakland neighborhood has been the focus of recent planting efforts by both the City of Oakland and a local non-profit, Urban Releaf. These planting programs seek to provide socioeconomic benefits and address environmental injustices in an underserved community. There was an initial neighborhood street tree inventory in 2006, followed by an annual census for tree mortality, removals, and new plantings. We observed an overall population increase during the five-year study period: 995 live street trees in 2006, and 1166 in 2011, for an increase of 17%. The annual mortality rate was 3.7%, which is within the range of typical street tree mortality rates from the literature review discussed earlier. So far, so good: the mortality rates are within the “normal” range and the population is on the rise. However, mortality of small, young trees was a serious problem that prevented the population from growing even faster.
Approximately half of the 2006 trees were small, with trunks 3 inches in diameter or less. Annual mortality in that smallest size class was 5.6%, about four times the rate for all the other size classes (Figure 5). In other words, most of the tree losses came from recently planted, small trees. The planting campaigns in this neighborhood were barely out-pacing young tree deaths, and could have had a larger impact if young tree survival were enhanced. These findings support an older arboriculture study, which suggested that young street tree death drives population cycles, and the need for replacement planting [25]. The West Oakland data also supports the concept of an establishment phase for urban trees – the first few years after planting during which trees are more likely to die, [26, 27] Extra vigilance during the establishment phase, in terms of maintenance and stewardship, might have the most payoff for ensuring planting survival, and thus achieving larger canopy objectives.
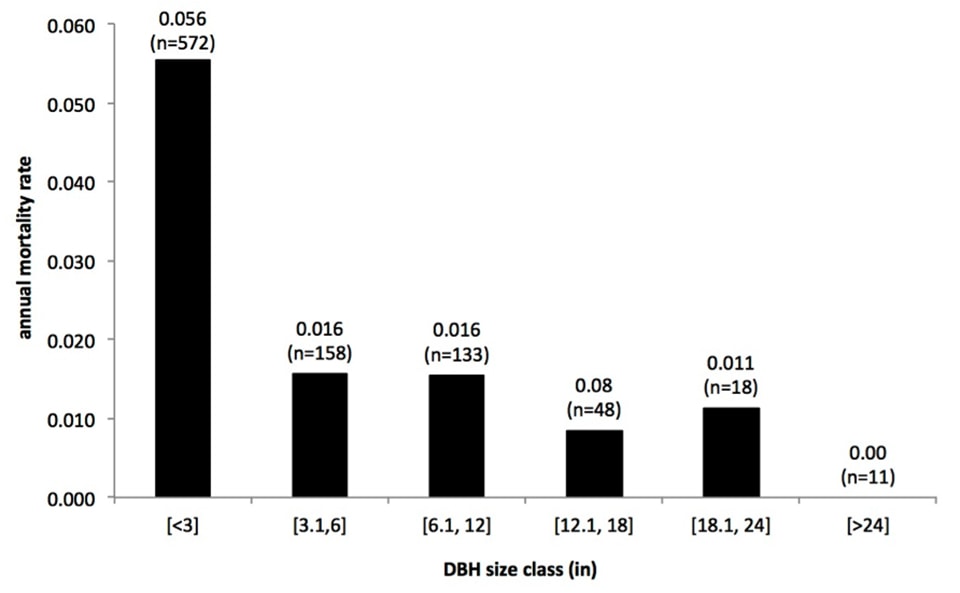
Figure 5. Size-class mortality curve for West Oakland street trees. Total n = 940. Adapted from Roman et al. (in press) [28].
Changing the conversation
The street tree studies discussed above are examples of demographic analysis applied to urban forests, illustrating the insights gained from a population ecology perspective. Assessments of urban tree mortality and monitoring data have implications for urban forest planners and designers. We need both more long-term data and appropriate analytical frameworks to understand the role of tree mortality in urban forest management. In order to reap the benefits of urban tree planting programs, the trees have to survive, thrive, and grow, within the context of an existing urban forest population of varying ages. Planting a few hundred trees, or even a million, does not automatically translate into an increase in the overall tree population over the long-term. To increase population levels, the survival and planting rates have to out-weigh losses from tree death and removal, including both old and young individuals. While this essay focused on street trees, the same underlying implications apply to trees in parks and residential lawns: many planted trees may not last to provide the ecosystem services that motivate planting campaigns [29]. This is a sobering thought, but an important one to bring to the surface in conversations between community foresters, policy-makers, landscape architects, planners, and researchers. Developing realistic projections about long-term urban forest population levels, canopy cover, and ecosystem services requires field data about mortality trends.
Let us shift the emphasis in urban forestry away from counting sheer numbers of trees planted, and towards touting exemplary records of tree survival. Rather than asking, “How many trees are enough?” I propose that the question be re-framed in a more nuanced manner: “To achieve a particular canopy cover goal, how many trees need to be planted every year?” Tackling this question involves knowledge about not only planting levels and mortality rates, but also natural seedling regeneration rates and urban-specific tree growth rates under varying site conditions. Managing towards a canopy cover goal necessitates consideration of urban tree population cycles: planting, growth, removal, and replacement.
Practitioners interested in making educated guesses about how their tree planting efforts compare to mortality losses can use new population projection tools under development by the Forest Service and OpenTreeMap [30]. However, even these tools are subject to great uncertainty in scenario-building, due to the lack of long-term monitoring data to produce reliable survival assumptions. Collaboration between researchers, arborists, urban forest managers, planners, and designers will be essential to produce longitudinal urban tree data [31], analyze that data with appropriate tools, and connect research results to practice. As both researchers and practitioners move forward and produce new data on tree mortality, growth and longevity, we can improve the tools available for urban forest managers to plan ahead, embedding their planting campaigns within the population dynamics of cultivated city landscapes.
Acknowledgements
I am grateful to many urban forest practitioners whose dedication to planting trees and studying mortality have inspired my research, especially colleagues at the Sacramento Tree Foundation, Urban Releaf, Canopy, Friends of the Urban Forest, NYC Parks & Recreation, and Pennsylvania Horticultural Society. I also thank M. Piana, N. Pevzner, D. Nowak, L. Mozingo, K. Podolak, S. Low, and G. Silvera Seamens for their thoughtful comments on this manuscript, and J. Battles, J. McBride, and the late F. Scatena for many conversations about ecological and demographic approaches to urban tree mortality that shaped my research.
 Lara A. Roman is a Research Ecologist with the USDA Forest Service, Philadelphia Field Station. Her current research uses analytical tools from demography and epidemiology to understand urban tree mortality rates and processes. She received a PhD in Environmental Science, Policy and Management at UC Berkeley, where she studied tree death in Sacramento and Oakland, CA. Lara serves as Secretary of the Urban Tree Growth & Longevity Working Group, and is leading the effort to develop standardized protocols for urban tree monitoring in partnership with researchers and community foresters across the US. Her studies take a participatory research approach, collaborating with non-profits and municipal arborists for study design and implementation. Lara also holds a Bachelors in Biology and Masters of Environmental Studies from the University of Pennsylvania.
Notes
[1] Georgia Silvera Seamans, “Mainstreaming the environmental benefits of street trees,” Urban Forestry & Urban Greening 12, no. 1 (2013): 2–11.
[2] Robert F. Young, “Mainstreaming urban ecosystem services: A national survey of municipal foresters,” Urban Ecosystems 16, no. 4 (2013): 703-722.
[3] TEEB – The Economics of Ecosystems and Biodiversity, “TEEB manual for cities: Ecosystem services in urban management,” (United Nations Environment Program, 2011), accessed at www.teebweb.org.
[4] Diane E. Pataki, et al., “Coupling biogeochemical cycles in urban environments: Ecosystem services, green solutions, and misconceptions,” Frontiers in Ecology and the Environment 9, no. 1 (2011): 27-36.
[5] David J. Nowak and Eric J. Greenfield, “Tree and impervious cover change in U.S. cities,” Urban Forestry & Urban Greening 11, no 1 (2012): 21-30.
[6] US Forest Service, Northern Research Station, “Urban tree canopy analysis helps urban planners with tree planting campaigns,” Northern Research Station Research Review 13 (2011). http://www.fs.fed.us/nrs/news/review/review-vol13.pdf.
[7] Arianna Morani, et al., “How to select the best tree planting locations to enhance air pollution removal in the MillionTreesNYC initiative,” Environmental Pollution 159, no. 5 (2011): 1040–7.
[8] David J. Nowak, “Silvics of an urban tree species: Norway maple (Acer platanoides L.).” (MS Thesis, State University of New York, College of Environmental Science & Forestry, 1986).
[9] E. Gregory McPherson, et al., Los Angeles 1-Million tree canopy cover assessment. USDA Forest Service, Pacific Southwest Research Station, GTR-207 (2008).
[10] Jacqueline W.T. Lu, et al., “Biological, social, and urban design factors affecting young street tree mortality in New York City,” Cities and the Environment 3 (2010).
[11] Lara A. Roman, “Urban tree mortality” (PhD Dissertation, University of California, Berkeley, 2013). This includes results of the Sacramento Shade Tree Program survival study, for which I tracked a cohort of yard trees for five years after distribution to residents. This program is funded by the local utility district and implemented by the Sacramento Tree Foundation.
[12] Ibid.
[13] Lara A. Roman et al., “Identifying common practices and challenges for local urban tree monitoring programs across the United States,” Arboriculture & Urban Forestry 39, no. 6 (2013): 292-299.
[14] Two notable exceptions are Lu et al. (2010) [10] and Steven Boyce, “It takes a stewardship village: Effect of volunteer tree stewardship on urban street tree mortality rates,” Cities and the Environment 3 (2010).
[15] Leda Marritz, “A million trees? Only if we can keep them around,” Next City, 1/18/2012, http://nextcity.org/daily/entry/a-million-trees-only-if-we-can-keep-them-around.
[16] “Urban Tree Growth & Longevity”, www.urbantreegrowth.org.
[17] Gary Moll, “The state of our urban forest,” American Forests 95 (1989): 61-64.
[18] Bob Skiera and Gary Moll, “The sad state of city trees,” American Forests (1992): 61-64.
[19] Lara A. Roman and Frederick N. Scatena, “Street tree survival rates: Meta-analysis of previous studies and application to a field survey in Philadelphia, PA, USA,” Urban Forestry & Urban Greening 10, no. 4 (2011): 269-274. This paper provides mathematical equations relating annual survival to long-term survivorship, mean life expectancy, and population half-life. These equations were adapted from classic demographic texts to street trees. With very low annual mortality rates, mean life expectancy would get absurdly high – hundreds or thousands of years – because of the asymptotic relationship between mean life expectancy and annual mortality.
[20] Ibid.
[21] The NYC street tree mortality study [10] found that over a quarter of trees had died 10 years after planting. This is also similar to the prediction from the survivorship curves in Figure 4. See [19] for a discussion of how to project the time at which 50% (or any other portion) of the planting cohort will be dead.
[22] Lara A. Roman and Frederick N. Scatena, “Street tree survival rates: Meta-analysis of previous studies and application to a field survey in Philadelphia, PA, USA,” Urban Forestry & Urban Greening 10, no. 4 (2011): 269-274.
[23] While seedling regeneration is likely negligible for street trees in most cities, regeneration is a major component of urban forest change in other land uses, such as remnant forest patches and private residential lands. Exotic invasives are an important contributor to natural regeneration. More details provided in David J. Nowak, “Contrasting natural regeneration and tree planting in fourteen North American cities,” Urban Forestry & Urban Greening 11, no. 4 (2012): 374-382.
[24] Lara A. Roman, John J. Battles and Joe R. McBride, “The balance of planting and mortality in a street tree population,” Urban Ecosystems (in press).
[25] Norman A. Richards, “Modeling survival and consequent replacement needs in a street tree population,” Journal of Arboriculture 5, no. 11 (1979): 251-255.
[26] Ibid.
[27] Randall H. Miller and Robert W. Miller, “Planting survival of selected street tree taxa,” Journal of Arboriculture 17, no. 7 (1991): 185-191.
[28] Lara A. Roman, John J. Battles and Joe R. McBride, “The balance of planting and mortality in a street tree population,” Urban Ecosystems (in press).
[29] While street tree survival studies are more abundant than other segments of the urban forest, the limited data available for other site types also suggests relatively high mortality. In the Sacramento Shade Tree Program, observed mortality was higher than program expectations for energy-saving benefits (Roman 2013) [11].
[30] i-Tree Forecast is in beta testing (David Nowak, personal communication with the author, www.itreetools.org), as is the population projection feature of OpenTreeMap (Deborah Boyer, personal communication with the author, https://opentreemap.org).
[31] Longitudinal data are repeated observations on the same individuals over time. Studies of health and mortality outcomes in epidemiology and demography use longitudinal data. Some long-term forest ecology data sets are longitudinal (e.g., repeated census of tagged trees on research plots), but in urban forestry, studies tracking the same individual trees have only recently begun.