Introduction: Rethinking Infrastructure

Infrastructure as Urbanism

In architecture, landscape architecture, ecology, economics, and even politics, we have recently seen the emergence of “infrastructure” as a central concept within the larger conversation about urbanism. Interest in urbanism has been growing over the last few decades alongside the realization of cities’ economic power and both the epic challenges and game-changing opportunities of the global migration to urban centers. The most difficult questions of urban performance, however, are often inseparable from the functioning and design of urban infrastructure.

Long focused on prominent civic objects and spaces in cities, designers are increasingly turning their attention to the less visible, but indispensible systems that underlie urban fabric. As designers expand the scale and scope of their projects, they are also recognizing the potential of infrastructure to serve as fertile conceptual territory. Unlike individual buildings (with the exception of megastructures), infrastructure can be seen as a tangible structuring device that operates at the scale of the city.  In embracing infrastructure, designers are extending their agency to look not just at the pieces and parts of the city, but at the design of entire systems and their operations. Infrastructure is also a civic project, and as such just as worthy of design consideration as the vernacular urban fabric and territory to which it gives structure. Finally, amid an accelerating cascade of small failures and several highly visible catastrophic collapses, the value of often-overlooked infrastructural systems is becoming more evident, sparking a perception of infrastructural crisis and finally getting some overdue attention [1].

More importantly for us, however, is the ability of infrastructure to offer a framework for asking larger questions about competing visions of urban structure and performance: about the relationship of a designed intervention to its surrounding biophysical flows; about the connection between a system, its context and constituents; about the role of social and economic forces in shaping urban life.

Buried Infrastructure

Photo by Nicholas Pevzner

Emerging Conversations

Over the last several years, we have seen a number of architectural events and publications focused on infrastructure and exploring the role of design in finding new solutions for complex and technical infrastructural challenges while empowering architects and landscape architects to ask infrastructural questions. For example, the WPA 2.0 competition in 2009, organized by UCLA’s CityLAB as a response to the US Recovery Act, prompted designers “to envision a new legacy of publicly-supported infrastructure, projects that explore the value of infrastructure not only as an engineering endeavor but as a robust design opportunity to strengthen communities and revitalize cities” [2]. MoMA’s Rising Currents: Projects for the New York Waterfront exhibition in 2010, invited interdisciplinary teams to take on the challenge of sea-level rise in New York Harbor and to, “imagine new ways to occupy the harbor itself with adaptive “soft” infrastructures… that change our relationship to one of the city’s great open spaces” [3].

The Landscape Infrastructure Symposium at the Harvard GSD in 2012, invited a group of architects, landscape architects, historians, engineers, and ecologists to explore ”the future of infrastructure and urbanization beyond the dogma of civil engineering and transportation planning” and “to propose responsive strategies that address the predominant challenges facing urban economies today” [4]. Additionally, picking up on a growing public discourse on infrastructure and reacting, often directly, to recent infrastructure failures, climate-related catastrophes and the continued failure of infrastructural systems to meet the needs of present populations, many design schools have conducted studios and seminars focused on infrastructure.

Infrastructure is certainly a topic of the day; in his 2013 State of the Union address, President Obama singled out infrastructure as a critical weakness and impediment to re-growing the US economy. Obama referenced 70,000 structurally deficient bridges across the US, and proposed an Infrastructure Bank that would seek private money to supplement public spending on ports, pipelines, roads, bridges, airports, high-speed rail, and self-healing power grids [5].

Every four years, the American Society of Civil Engineers is tasked with evaluating the current condition and performance of the nation’s infrastructure. This year, they gave the country a D+ rating (up from a D rating in 2009) and estimated a need for $3.6 trillion in investments over the next seven years [6].

In the wake of superstorm Sandy, which made highly visible the infrastructural fragility of the New York metropolitan area and the New Jersey shoreline, the simmering conversation about the infrastructure of coastal defense and urban resilience has boiled over, reaching a visibility not seen since the days after Katrina. Along the eastern seaboard, serious debates between proponents and opponents of “hard” engineered defenses are ongoing, representing a kind of proxy war between traditional engineering approaches and an emerging alliance of advocates for more flexible and responsive, though mostly still untested, “soft” systems.

Sandy_Shoreline

Aftermath of Superstorm Sandy, Rockaways. Photo by Nicholas Pevzner

From Landscape Urbanism to Landscape Infrastructure

In many ways, landscape infrastructure builds on the theoretical ground pioneered by landscape urbanism. Early theorists of landscape urbanism were interested in describing the city as a landscape, overcoming the binary between urban and rural (and urban and natural) that reigned at the time [7,8].

Drawing from narratives of cultural and political geography, these writers were interested in reexamining the physical parts that make up a city, along with all the related components scattered across the horizontal urban field (blocks, buildings, parks, watersheds, foodsheds, and habitats to name just a few). They were also concerned with the social and economic drivers at play in the urban landscape [9,10].

Whereas landscape urbanism looked to open conversations with developers, planners and policy makers in order to give landscape a role in shaping urban growth, landscape infrastructure attempts to bring civil engineers, highway departments, international shippers, the US Army Corps of Engineers, and similarly massive players on the national and global stage into the game.

Mumbai

Filled mangrove near Bandra Station, Mumbai. Photo by Stephanie Carlisle

The Essays

Despite all the newfound attention, the definition of infrastructure is still very much in flux. Scenario 3: Rethinking Infrastructure brings together a group of pieces that take on the design of infrastructure from a number of scales and disciplinary perspectives. This issue highlights how practitioners and theorists are expanding the definition of infrastructure, analyzing its component parts, and proposing new kinds of infrastructure projects.

In his essay The Humanity of Infrastructure:  Landscape as Operative Ground, Dane Carlson looks beyond the discrete infrastructural objects that underlie contemporary cities and their peripheries, so as to recontexualize the landscape itself as the infrastructure for human inhabitation. Even pre-industrial landscapes have long operated infrastructurally from a biophysical perspective, he argues, and people have long merged constructed elements with natural functions.

Meg Studer’s project NaCl: Operations Enabling Emptiness explores the systems and networks of exchanges by which millions of tons of road salt transform the roadways of the Northeast corridor, mapping the flows of a vast anthropogenic material infrastructure and tracing the unexpected causal relationships that link landscapes of extraction, distribution, commerce and consumption.

In Feedback: Designing the Dredge Cycle, Rob Holms and Brett Milligan examine the implications of another set of anthropogenic and logistical landscapes, describing the sedimentary infrastructure that links the degradation of costal landscapes, the expansion of international shipping networks, the development of coastal communities and the creation of new, constructed landscapes. They recast dredge material as both an inevitable byproduct of global market forces, but also an exciting, albeit challenging, material for a whole new genre of coastal landscapes.

Michael Ezban’s Aqueous Ecologies proposes the integration of a closed-loop aquaculture system with local development, imaging the economic and cultural synergies between productive landscapes, wastewater treatment and urban development that enhance surrounding natural ecosystems.

Applying the idea of synthetic landscape infrastructure systems to a city in which typologies of infrastructure-supported dense development have proved unsustainable, Jill Desimini, in her essay, Wild Innovation: Stoss in Detroit, offers an alternative model of design and decision-making, in which zoning, regulations, productive landscapes, and blue- and green infrastructure are all combined into a strategic landscape planning process.

Scott Muller explores the role of markets and community actors further in his piece, The Next Generation of Infrastructure, arguing that in an unstable global investment climate, we need to focus much more on the process by which cities and societies make decisions about large infrastructure projects, and on growing an effective social infrastructure that can empower citizens and policymakers to put their cities on the correct decision pathways.

In Contemporary Infrastructure, an interview with Ksenia Kagner, Marcel Smets talks about the importance of design investment in the public realm for constructing high-value urban areas, why transportation projects are particularly compelling areas of investment by government, and about how to get designers more integrated into the decision-making process that produces infrastructure.

Margie Ruddick’s Queens Plaza project offers a critique of the traffic-first approach to city streets, and provides an example of landscape architecture offering both a transportation design and a high-performing public space solution.

In Skeleton Forms: The Architecture of Infrastructure, Laila Seewang looks at how applying architectural parameters to a city’s infrastructural objects — by focusing on boundary, form, and symbolism — a historical reading can emerge that captures the interplay of forces that have driven that city’s development.

In Made in Australia: The Future of Australian Cities, Richard Weller and Julian Bolleter grapple with the pressure of accommodating the rapid growth of Australia’s urban population. The authors argue for the need to rethink local settlement patterns that encourage sprawl, and put in place megaregional infrastructure projects capable of steering growth trajectories and of supporting the development of new high-quality, liveable cities.

Laura Solano zooms in to focus on the constructed nature of urban soil. Her essay, Reconsidering the Underworld of Urban Soils, points to the many ways in which the quality and treatment of soil on a site determine the success or failure of urban landscape projects, and all the urbanistic goals that rest on them; in her view, soil is the microscopic infrastructure for the performance of the city above.

In his essay From Landscaping to Infrastructure: The Scope and Agency of Maintenance, Michael Geffel presents the often-overlooked processes of landscape maintenance as a design opportunity, whether at the scale of the lawn, the power-line corridor, or massive coastal dune creation. If considered as an infrastructural service underlying entire landscape systems, he argues, the redesign of maintenance regimes offers designers a tool for effecting change at a vast scale.

In Yangtze River Delta Project, Catherine Seavitt examines the infrastructure of coastal defense in Shanghai, noting the increasing pressures on hard-engineered coastal protections from changing weather and rising seas, and proposes an adaptive, resilient landscape-based approach to flood protection.

In Productive Filtration: Living Systems Infrastructure in Calcutta, Stephanie Carlisle uses the case study of a sewage-fed aquaculture wetland that developed over a century of local experimentation and negotiation. The piece uses dynamic system modeling to explore the interconnected biological, social and economic components that balance the wetland’s multiple functions, allowing for the testing of future development scenarios.

The pieces represented in this collection have all grappled with the pressing question of how infrastructure of the next century will be imagined and built. We hope that you enjoy this issue of Scenario Journal and that you find it useful in expanding the dialogue on the creative and critical potential of infrastructure in your own work.


Stephanie Carlisle is a designer and environmental researcher whose work focuses on the relationship between the built and natural environment. She works in the research group at KieranTimberlake Architects. She is a co-editor of this issue. 


PEVZNER_NICHOLAS

Nicholas Pevzner’s work explores the role that infrastructural landscape moves can play in structuring and sustaining healthy cities. He teaches in the Department of Landscape Architecture and Regional Planning at the University of Pennsylvania School of Design. He is a co-editor of this issue. 


 Refrences

[1] Pierre Bélanger, “Redefining Infrastructure,” in Ecological Urbanism, ed. Mohsen Mostafavi and Gareth Doherty [Baden, Switzerland: lars Muller Publishers, 2010], 341-344.
[2] “About WPA 2.0,” accessed May 20, 2013, http://wpa2.aud.ucla.edu/info/index.php?/about/about/.
[3] “Exhibitions: Rising Currents: Projects for New York’s Waterfront,” MoMA. Updated March 22, 2010, accessed on May 22, 2013, http://www.moma.org/visit/calendar/exhibitions/1031.
[4] “Events: Landscape Infrastructure Symposium,” Harvard Graduate School of Design, March 23-24, 2012 accessed at http://www.gsd.harvard.edu/#/events/landscape-infrastructure.html.
[5] “Remarks by the President in the State of the Union Address,”  transcript of the President’s speech, Office of the Press Secretary, February 12, 2013. Accessed at http://www.whitehouse.gov/the-press-office/2013/02/12/remarks-president-state-union-address.
[6] American Society of Civil Engineers, “2013 Report Card for America’s Infrastructure” (Report, ASCE, 2013) accessible in full at http://www.infrastructurereportcard.org/a/#p/home.
[7] James Corner, “Ecology and landscape as agents of creativity” in Ecological design and planning (1997): 80-108.
[8] James Corner, ed., Recovering Landscape (New York: Princeton Architectural Press, 1999)
[9] Ibid.
[10] Charles Waldheim, ed., The Landscape Urbanism Reader (New York: Princeton Architectural Press, 2006)


The Humanity Of Infrastructure: Landscape As Operative Ground

The ubiquity of contemporary infrastructure cannot be overstated; it silently conveys, inhibits, facilitates, mediates, and in so doing forms the foundation of humanity’s existence. As a result, infrastructure as we know it has become both culturally and physically peripheral, resigned to crumble and rot as it waits to be replaced. In recent years, landscape historians, urban theorists, and designers have turned their gaze once again to focus on the vast networks of infrastructure that underlie our cities and metropolises in order to begin to address the ever increasing pressures placed on contemporary cities and the innumerable biophysical systems with which they interface. The study of infrastructure as an industrial urban phenomenon, however, neglects millennia of infrastructural practice in the city, its periphery, and far beyond. It is necessary to recontextualize landscape, the common medium for human inhabitation, as infrastructure; a practice inexorably tied to the history of human civilization.

LA aqueduct Introduced hydrology: The Central Arizona Aqueduct is a 336 mile canal that diverts water from the Colorado River in order to irrigate a million acres of farmland in central Arizona and to provide municipal water in Pheonix and Tucson.  Image by USBR on Flickr.

For the purpose of this discussion, infrastructure can be defined as those systems, works, and networks upon which the function of any system of human inhabitation is reliant. According to Bhatia, it has become apparent that “the natural environment is perhaps the only issue that affects all of humanity equally,” and a renewed “emphasis on the collective natural environment repositions the role of infrastructure as the foundational spatial format, as it allows for the interconnection between the human and environmental spheres [1]. Landscape is Bhatia’s infrastructure. Landscape is inherently infrastructural: it mediates, produces, facilitates, and transports. As a network of infrastructural function and flow, landscape (here considered to be a result of human modification of an environment) becomes the operative platform of human existence; where landscape exists, so does infrastructure. Landscape is the medium through which culture, society, and the individual interact with biophysical, meteorological, and geological fluctuation or stasis. Landscape is a conduit, an exaggerator, a proliferator, an inhibitor, an enabler; herein lies its timeless operative capacity.

Seal hunter

Evolving platform: Ice floes serve as an ephemeral productive platform in the Arctic, continually moving, forming, and melting. Image by oh contraire on Flickr.  

In his piece “Redefining Infrastructure,” Pierre Belanger proposes the replacement of this state of infrastructure with an infrastructural system aligned with ecology and other biophysical systems, recognizing that “the economy is now inseparable from the environment” [2]. While this piece sets the stage for this new proposal, it does so without referencing several key components of infrastructure and its history. Belanger, in his recent work, operates with a much more narrowly defined definition of infrastructure, limiting it to “the set of systems, works, and networks upon which an industrial economy is reliant—in other words, the underpinnings of modern societies and economies,” and as “the basic system of essential services that support a city, region, or nation” [3]. Systems of transport, water, commerce, and production are these underpinnings, the “system of essential services.”

Belanger argues that, in the era of the megalopolis and industrial state, infrastructure has gained a new degree of visibility and complexity which separates it from the entire pre-industrial history of human life and culture. This perception, perhaps largely due to disastrous infrastructural failures as discussed in the piece, is flawed [4]. Infrastructure is an inherently human and cultural phenomenon not limited to industrial and contemporary civilization, but something which has been continuously produced and managed for millennia to sustain human civilizations of many scales and levels of technological capacity.

In “Redefining Infrastructure,” infrastructure is investigated through case study as a series of systems hard rather than soft in nature (concrete/steel/asphalt/aggregate) and largely divorced from biophysical function. Belanger’s redefinition of infrastructure proposes to reevaluate this separation. However, it is possible that Belanger’s definition and treatment of infrastructure itself contributes to the separation between “hard” and “soft” infrastructures – ignoring the historic spaces of overlap, the productive grey zones in which landscape has historically functioned as dynamic, adaptive and managed infrastructural systems. Landscape is defined by human intervention, created through the interactions of humans and a given environment. If we understand landscape to be the result of modification or utilization, and facilitation of program is the intent of modification, landscape becomes infrastructural whenever it is created. When landscape is modified and inhabited, it becomes the medium through which humanity can produce, move, and live. As landscape fulfills these roles, it becomes infrastructural. By proposing the integration of ecology and economy, as well as the creation of synergistic design through “interconnectivity and interdependence,” Belanger suggests the necessity to understand landscape, and the processes and systems which inhabit it (such as ecology) as an operative infrastructural ground [5]. Through this understanding, Belanger’s proposal to integrate contemporary infrastructure with biophysical systems can transcend the reappropriation of current infrastructural typologies to develop an infrastructural proposal utilizing landscape as operative ground.

Qanat aerial

Delving deep: A qanat system in an Iranian desert tunnels deep into the mountain profile, tapping subterranean water for agricultural use where water is otherwise unavailable.  NASA image created by Jesse Allen, using data from NASA/GSFC/METI/ERSDAC/JAROS, and the U.S./Japan ASTER Science Team.

Infrastructure, by definition, sustains and defines all human settlement and activity. For example, a series of canals to a remote farmstead provides an essential service in the form of irrigation, thus becoming infrastructural, and in turn represents part of a much larger system of food production and distribution vital to the support of human settlements. Even a network of fruit trees connected by footpaths is an infrastructural network; a physical intervention and selective management regime designed to provide essential services (production of food) to a specific population. In Nicaragua, harvesting of fruits from the tamarind tree results in the emergence of an ephemeral landscape infrastructure as the ground underneath each tree is cleared before harvesting, resulting in network of circular clearings below the dense tree canopy. Transhumance practices, such as the veranadas of South America, also create a landscape infrastructural network defined by seasonal and climatic flux through the movement of livestock to different seasonal pastures.

Veranada

Livestock ranchers in South America, shown here in Chile’s Tierra del Fuego, undertake seasonal journeys, or veranadas, to bring livestock to winter pasture in the high mountains. Image by Robert Cutts on Flickr.

yaks

The Indomitable Yak: Yaks are able to survive in the arid, high altitude climate of the Tibetan plateau and provide many Tibetans with myriad supplies and products which are integrated into daily life. Image by Steve Hicks on Flickr.

Recent urging for a new ecological infrastructure that integrates biophysical systems and engineered, infrastructural elements could more accurately be described as a re-integration of ecology, landscape and infrastructure in the city. Oyster-tecture and A New Urban Ground, projects completed for the MOMA Rising Currents exhibition of 2010 by Scape Landscape Architects and ARO/dlandstudio, are canonical examples which recognize biophysical function as an integral component of the survival of the city.

By calling for reintegration rather than integration, the diverse and complex history of human infrastructural works is recognized. The cradles of civilization in Mesopotamia, Egypt, Indus Valley, and Yellow River valley provide a strong precedent. For these civilizations, the river was the infrastructural backbone of life. Each culture was initially defined by a river which provided transportation, irrigation, and fertility. Although human interventions during the initial evolution of civilization were relatively minor compared to contemporary infrastructural systems, the infrastructure of the ancient world was no less integral to human survival and prosperity. For example, use of a river by a fishing boat transforms it into an infrastructural entity through the introduction of a system of production derived from the landscape, and this system of production was part of a much larger network of food provision. The Tigris, Euphrates, Indus, Yellow, and Nile rivers were the physical operative platform for the systems which provided basic services and necessities for each civilization.

Kennebec River logs

The river, reimagined: Maine’s Kennebec River, one of the many worldwide to be utilized as an infrastructural conduit for transit. Image by Leslie Jones, 1922. Courtesy of Boston Public Library Digital Collection

Road infrastructure, perhaps the most ubiquitous infrastructure of the contemporary era, has a deeply historical presence in the evolution of the human narratives of commerce, industry, governance, and communication. Although historical road infrastructure tended to be limited in function, typically intended for imperial, commercial, and military purposes, its scale was at times no less grand or complex than that of the industrial age. Roman roads, the Silk Road and its caravanserai network, the Persian royal road, and even Saharan trade routes were far-flung trade and transportation networks designed to facilitate the movement of troops and goods (usually accompanied by ideas), much like the American highway system. For example, the Persian royal road was the backbone of the empire’s communication system, providing an official conduit for the movement of goods, imperial edicts, and messages [6]. Rest houses were located at every twelfth mile and stocked with fresh horses to expedite transport. The planning of the road even responded to biophysical conditions, having been diverted in various locations to avoid lands which were subject to frequent flooding [7]. These highly complex systems were integral to the function of the imperial state, and as such can be considered infrastructural.

The Silk Road, stretching through Asia and Europe for many centuries, is perhaps the most intriguing precedent of a vast infrastructural network that transcended regional, cultural, and religious boundaries. The Silk Road was a network on which innumerable economies were reliant, playing instrumental roles in the movement of goods overland through vast territories. Although the trade routes of the Silk Road were often little more than a trail through the mountains or a directional heading, the network enabled the integration of a vast Eurasian network of production and consumption. In addition to a network of connection vectors, the route was punctuated by a point matrix of caravanserai which facilitated the movement of goods by providing secure lodging, storage, and a site for cultural and commercial exchange [8]. Understanding the Silk Road as a commercial infrastructure meant to facilitate trade and exchange, as well as the smaller, peripheral infrastructural networks which allowed it to function, allows us to again consider a definition of infrastructure as “those systems, works, and networks upon which the function of any system of human inhabitation is reliant.”

Although none of the economies served by the Silk Road were industrial, it was undoubtedly a system upon which these economies, and the economy of Eurasia as a whole, were heavily reliant. Goods and money were not the only things being exchanged along this trade route; the Silk Road was also largely responsible for the evolution of several syncretic cultures in Central Asia, aided by the presence of numerous monasteries along the great roads which facilitated the spread of Buddhism, Islam, and Nestorianism [9]. Khotan emerged as one of these syncretic city-states, becoming a merchant crossroads for the silk and jade trade as China reached beyond its western borders toward Parthia and Bactria [10]. This cultural evolution demonstrates the capacity of landscape infrastructure to act as a strategic agent of culture through facilitation of movement, an argument well articulated in the work of Simon Swaffield [11]. As with contemporary infrastructural networks, the complexity and dynamism of these pre-industrial networks was so vast that it was almost impossible to understand them as single systems, perhaps because such a thing is almost mythological in its rarity; both ancient and modern infrastructures are inclusive of many systems and complexities.

While the industrial revolution may have exacerbated the apparent conflict between economy and ecology, as noted by Belanger, this seemingly intractable tradeoff is not a historic constant. We can also look to historical infrastructure to provide precedents of balanced ecological environmental and economic function long before the onset of the industrial age [12]. For example, the chinampa agricultural system of the Aztec capital Tenochtitlan was formed by a series of canals which provided continuous subsurface irrigation to island agricultural plots fertilized by nutrient-rich muck from the bottom of Lake Texcoco. By utilizing the existing network of biophysical systems and creating an infrastructural landscape specifically designed for this production system, the chinampas were able to produce an astounding amount of crop yields (up to seven crops of corn per year) [13]. Not only was the provision of food an infrastructural system in itself, but the series of canals joining the chinampas allowed goods to be directly taken to market via waterway in addition to providing fertilization and irrigation.

In North America, the agricultural systems of the Eastern woodlands Indians are also a valuable precedent of infrastructure and ecology functioning closely in tandem. Through the introduction of a dense and continually evolving matrix of forest burns, these Indians created a continuous infrastructural surface designed to produce food and facilitate movement of people and game through vast areas of edge habitat and managed production zones. This burning regimen recognized temporal flux, seasonal or otherwise, as a critical component of landscape and infrastructural process (the production and supply of food), resulting in varying types of cultivation and gathering through seasons, etc. [14]. The burn matrix actively facilitated the accumulation of soil organic matter, increased growth rates and opportunities for gatherable plant species, and increased edge habitat for game species. Successful management ensured that this system was propagated in conjunction with biophysical function. If infrastructure is to be defined as “the basic system of essential services that support a city, region, or nation,” every element of the eastern woodlands agricultural system can be seen as infrastructure.

axon progression combine

La Prusia: Growth defined by adjacency and productive capacity. Image by Dane Carlson, 2012.

Increasing magnitudes of hydrological, meteorological, and geological flux have revealed many of our vulnerabilities as builders and inhabitors of landscape. Within this context, the precept of planning for failure through adoption of systems “reliant on a culture of contingency and preparedness” identified by Belanger is increasingly becoming recognized as necessary, potentially providing a framework for a systematic response to all degrees of flux [15]. Flux is process, whether it be succession of plant communities or changing of the seasons, and “process engages the dynamic conditions of the landscape—living material that changes over time” [16]. The reference to living material is not limited to plant matter, but also water, soil, biota, and every other minute component of landscape. All of these components are integral to the function of landscape as an infrastructural platform defined by process and change. Flux may be gradual or cyclical, but it also has the potential to be violent and immediate. Fisher acknowledges a recent history of disasters caused or exacerbated by ignorance of potential flux or attempts to prevent, rather than adapt to, fluctuation; perhaps most notably the post-Katrina flooding of New Orleans in 2005 [17]. These failures stem from what Fisher defines as fracture-critical design, “in which structures and systems have so little redundancy and so much interconnectedness and misguided efficiency that they fail completely if any one part does not perform as intended [18].

Landscape is not purely a temporal or biophysical phenomenon; culture is an integral component in the formation of both landscape and the infrastructural systems which transverse it, many of which are unique to place and people. Denis Cosgrove says of J.B. Jackson: “more evident perhaps is the influence of his consistent demonstration that landscapes emerge from specific geographical, social, and cultural circumstances; that landscape is embedded in the practical uses of the physical world as nature and territory” [19]. These “practical uses of the physical world” are infrastructural: transport, production, mediation, facilitation. The geographic, social, and cultural origins of landscape, as stated here by Cosgrove, mark landscape and infrastructure as human, not pre or post- industrial, and rooted (in origin) in biophysical systems specific to place and time.

carlson_ghats2Ritual infrastructure:  Ghats, seen here on the Ganges at Varanasi, perform many ritual functions for Hindu adherents. Image by Samuel Bourne, 1865.

The recent trend of soft infrastructure proposals and “ecologically driven landscape infrastructure proposal is necessary and timely, but tends to be limited in scope and ambition through the overemphasis of an artificially bounded urban condition. Understanding infrastructure as an industrial or urban phenomenon limits the potential of infrastructure to be redefined, essentially only allowing us to reevaluate existing infrastructural typologies. Expanding our view to include historical precedents of both pre-and post-industrial infrastructures and landscape may serve to elucidate potential intersections between infrastructure and biophysical, meteorological, and geological systems, providing fertile ground for the expansion of infrastructure that is defined by landscape rather than the reverse.

By understanding landscape as the operative ground for infrastructure, and any landscape intervention as inherently infrastructural, our ability to radically redefine infrastructure is expanded and solidified. Recognition of the combined cultural and biophysical parentage of infrastructure also brings historical case study (beyond the industrial age) to a point of particular relevance. Integration of infrastructure with biophysical systems is not a phenomenon limited to a potential future, but has been achieved on a significant scale for thousands of years; rather than discovering this anew, we have the opportunity to rediscover biophysical infrastructure as an integral component of landscape.


Dane CarlsonDane Carlson is a landscape architectural designer currently pursuing an MLA at Harvard’s Graduate School of Design, and received his Bachelor of Landscape Architecture from the College of Architecture and Planning at Ball State University in 2011.  Currently working to investigate landscape as a productive cultural phenomenon through design and research, his interests vary geographically from Chilean Patagonia to Nepal.  As a Community Service Fellow at the Graduate School of Design, Dane will pursue the development of productive cultural landscape design in sub-Saharan Africa at MASS Design Group in Boston.


 Resources

[1]  Bhatia, Neeraj. “Resilient Infrastructures.” In Goes Soft: Bracket 2. Ed. Lola Sheppard and Neeraj Bhatia. Barcelona: Actar, 2012. p219.
[2]  Belanger, Pierre. “Redefining Infrastructure,” Ecological Urbanism, Mohsen Mostafavi and Gareth Doherty eds. Baden: Lars Muller Publishers, 2010. p345.
[3]  Ibid. p333.
[4]  Ibid. p332.
[5]  Ibid. p345.
[6]  Schreiber, Hermann. trans. Stewart Thomson. The History of Roads: from Amber Route to Motorway. (London: Barrie and Rockliff, 1961), 13.
[7]  Ibid. p13.
[8]  Ibid. p46.
[9]  Ibid. p13.
[10]  Ibid. p33.
[11]  Swaffield, Simon, “Introduction: Theory in Landscape Architecture,” Theory in Landscape Architecture: A Reader, ed. Simon Swaffield. Philadelphia: Univ. of Philadelphia Press, 2002
[12]  Belanger, Redefining Infrastructure, 345.
[13]  Aguilar-Moreno, Manuel. Handbook to Life in the Aztec World. New York: Facts on File, Inc. 2006. p318.
[14]  Cronon, William. Changes in the Land. New York: Hill and Wang; a Division of Farrar, Straus, and Giroux, 2003. p37.
[15]  Belanger, Redefining Infrastructure, 345.
[16]  Berrizbeitia, Anita. “Re-Placing Process,” Large Parks, ed. Julia Czerniak and George Hargreaves. New York: Princeton Architectural Press, 2007. p177.
[17]  Fisher, Thomas. Designing to Avoid Disaster: The Nature of Fracture-critical Design. New York: Routledge, 2013, p5.
[18]  Ibid. Introduction.
[19]  Cosgrove, Denis. “Introductory Essay for the Paperback Edition,” Social Formation and Symbolic Landscape, first published 1984. Madison: University of Wisconsin, 1998.

NaCl: Operations Enabling Emptiness

Interrogating infrastructure starts simply, slowly. It is found in the openings in plain sight, in the re-conceptualization of our inherited systems as much as speculative proposals. After all, industrial ecology is embedded in even the most monolithic and ‘surficial’ of modern systems [0,1]. The existing interstate, for example, relies on labor, materials, capital costs, installation techniques, containerized transfer mechanisms, and legislative will; it is a mixed ‘eco-system’ of maintenance resources and operational relays that lurk behind familiar forms of automotive transport [2].

Over the past decades, a number of landscape urbanist provocations began unpacking its territories and flows, often, one material at a time: Pierre Belanger’s “Synthetic Surface” examined North American asphalt, contextualizing its climatically-driven development and on-going, organizational effects. CLUI’s “Trans-Alaska Pipeline” [3] and Kelly Doran’s “Tar Sands” both explored petroleum dependence, excavating the extended supply-chains, sited details, and longer-term trajectories of peak supply [4]. Other infrastructural components— jersey barriers, FHA standards, and the environmental costs of concrete—have been so thoroughly historicized, quantified, and fetishized in design culture that it’s hard to cite just a single source of inspiration.

The following road salt mappings extend this critical, excavative agenda. In the void between integrated roadway materials and individuated automotive consumption, these graphics trace out the largely state-supported systems that transform our highways, bi-way and city streets from seasonably passable, climatically contingent networks to eminently open, logistic lines. In advance of dilution and dispersion across sidewalks and gritty rows, millions of stockpiled tons, clearance crew hours, and budget bylines make emptiness and access possible. Thus, beginning with road salt usage in New York and the Northeast Corridor, this portrait proceeds through a nested series of quantitative geographies, uncovering the energy, envelopes, agents, trips, trade, territories, mechanisms and symbiotic scenarios of salt procurement and distribution.

Please join me in mapping the industrial ecologies of roadway melt, the openings of erasure, erosion, and emptiness.

template_salt

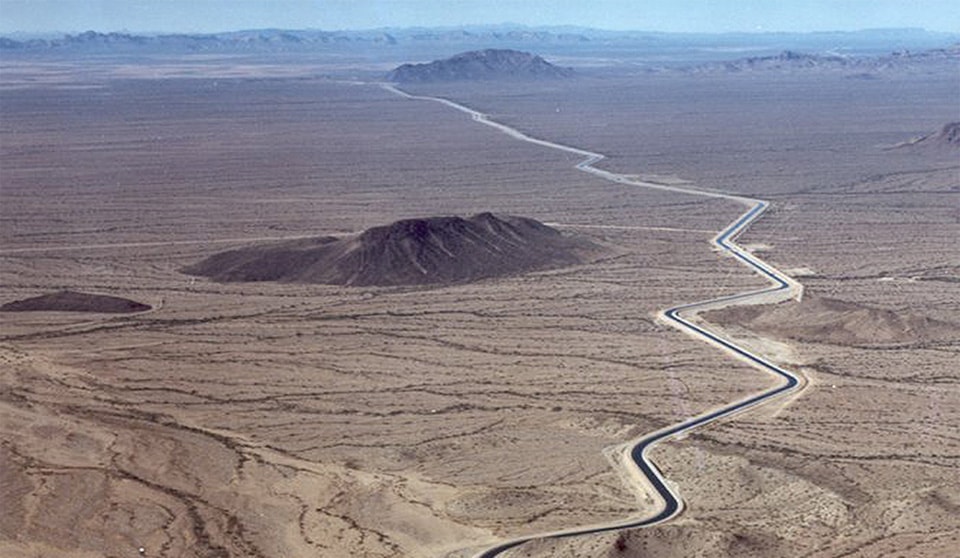
Figure 1  NATIONAL PRODUCTION: Regional resources and intensive application along the North East Corridor. Image © Meg Studer

NaCl: National Production

Today, between 52-53% of national salt consumption is devoted to seasonal roadway clearance [5]. The Northeast metropolitan corridor (unsurprisingly) consumes a disproportionate amount of this de-icing supply. Density of development, temperate jet-stream and liminal lake effect collude for climatic impact; Snowbanks sabotage J.I.T. supply chains. Blizzards bury business hours. Winter road closures cost the economy as much as $10 billion per day [6]. The Rockies and arid west may depend on snowpack for water storage and ski season, but, along the Atlantic, logistic, commerce and culture cannot wait for frozen, flaky water.

Thus, 11.7 million tons of road salt were applied here in 2008 [7]. Convenient and cheap, 42% of national stocks lie scattered between Baltimore, Boston and upstate New York, with regional resources and ease of access driving costs down to $55-65 per ton [8]. Mines beneath the Great Lakes and the Maritime Provinces serve as supplemental sources in extreme seasons. Although occasionally cities amend salt with alternate de-icers and adhesive brines, like calcium chloride and beet molasses, salt’s economic availability guarantees market hegemony.

Yet, just because salt itself is an inexpensive mineral melter, doesn’t mean that de-icing regimes are cheap. Rock salt and brine constitute, on average, 25% of de-icing budgets [9]. The larger costs of keeping roads open in the winter derive from the extensive dispersal and distribution mechanisms engaged: depot stocking, extended overtime, scrapers, spreaders, loaders, brine machines, tankers, fuel, stevedores, diesel melters, and so on… (not to mention chemical and environmental effects).

template_salt3_LUCOM

Figure 2  NE DISTRIBUTION: Between the Appalachians and the Atlantic, post-war salting has evolved into a consolidated, relatively inelastic, if geographically complex, market and municipal utility.  Image © Meg Studer

NaCl: North-East Distribution 

Road salt application has evolved in tandem with several modern circulation systems. The Victorians, for example, called the process salt-watering. The requisite brine was abundantly available, thanks to new mining techniques—coal prospecting—and disused Enlightenment bathing reservoirs [10]. At first, salt was applied to roads with the aim of dampening dust and stabilizing soil [11]. In 1877, HD Pearsall, CE, observed an additional salutary effect, remarking that “frost is much less liable to injure the road . . . as it rarely happens in England that the frost is severe enough to freeze salt water at all, especially at some inches under the surface” [12].

In the 1930s, engineers in Connecticut and Michigan modified this surface application [13,14,15]. By mixing salts directly into roadbed foundations, they kept the sodden, glacial clays and extreme free-thaw cycles of North American from generating radical road upheaval. In 1941, New Hampshire adopted the use of industrial spreaders for dry surface salting and gritting. Following the Eisenhower interstate build-out, other states crafted policies of their own. By the mid-50’s, New York and several other urban areas had shifted to using salt alone for its invisible, immediate maintenance demands [16].

Today, the Northeast’s consolidated yet complex salt distribution system covers nearly 90,000 miles of highway. Eight major corporations supply salt to over 1200 state DOT depots and countless municipal co-operative buyers. In Pennsylvania alone, over 1400 separate township depots require restocking each year [17,18]. With over 90% of all road salt purchases either by or through state procurement offices, salt has become a seasonal utility.

template_salt4_LUCOM

Figure 3 NYSDOT DISTRIBUTION: Corporate supply chains, depot constellations, and delivery choreography in New York State exemplify the dynamic feedback of salt for and within logistics networks.  Image © Meg Studer

NaCl: NYSDOT Distribution

Salt underpins, but is also enabled by today’s vast, consolidated transport chains. New York State, the nation’s third largest salt producer and home to the nation’s third largest port, offers an interesting, if slightly amplified illustration of the logistical links between fleet ownership, inclement delivery, and the dynamics of salt sourcing. Here, resources are split between domestic production—lateral veins beneath the Finger Lakes—and international imports. Upstate, American Rock Salt, and Cargill operate mines and brine plants, as well as their own multimodal and hopper rail fleets. Cargill, Atlantic, and International Salt Co (with K+S and Morton) import vast loads of rock salt from S. America and the Caribbean to their docks in Newark, Staten Island, and Albany [19,20,21]. While Atlantic relies on chartered crafts, Cargill, and International own their own shipping lines.

Here, fleet control, computer tracking, and berth ownership have enabled the industry to stockpile supplies at distribution nodes and within circulation spaces. For example, Cargill (NY/NJ) runs over 200 hoppers in New York (out of ~1,300) and two berths at Newark’s bulk facilities. This includes 70-120 odd car trains for initial seasonal stocking. Their control of row/ sidetracks and multimodal hubs enables storage at secondary sites and selective deployment of mobile stocks [22,23].  Given that annual state consumption exceeds DOT storage capacity by somewhere between 30 to 50%, this internally distributed system enables quicker, shorter shipping legs and accommodates exceptionally snowy seasons.

In fact, New York State salt contracts are written with this distribution system in mind. Municipal customers are told that their deliveries, no matter the season, will arrive daily in staggered amounts of 600 tons, then 200 tons every day until order are fulfilled. This banks on reasonably close hopper loads, with lower daily volumes and longer lead times for larger orders [24]. It also allows townships to order salt for a week-long storm, even if they don’t have the full storage: they just need to use a bit more than those later, daily deliveries. While other states, like Connecticut, have tried to neutralize transportation entanglements by requiring full stockpiles by the first of November, in New York the salt distribution system acts as its own dynamic storage [25]

template_salt5_LUCOM

Figure 4 NYC DISTRIBUTION: Behind NYC’s ‘grid’ of easily accessible depots, the distribution of salt requires extensive overtime labor, thousands of miles of driving (and fuel), and even short-term, independent equipment contracts. Image © Meg Studer

NaCl: NYC Distribution

The port cities of New York, Boston, Philadelphia and Baltimore all fight snow with imported salt, waterborne local distribution networks, and extended sanitation shifts. For example, New York City’s annual allowance — roughly 300 thousand tons of Chilean rock salt—is supplied by International Salt Co. through the port of Newark [26]. From there, International’s feeder barges transport salt to major depots in Brooklyn, Albany, and up the Sound to New Haven [27]. In transit between (and pulling from) these stocks, International is able to deliver to roughly half of New York’s salt sheds (about 20 sit directly on or adjacent to the water, despite EPA clean-water concerns).  The city sanitation department uses its 282 loaders and 149 ‘cut-down’ trucks to transfer supplies to the remaining 16 inland domes and storage piles [28,29].

In a storm event, the average depot has a little over 200 miles of road to cover and clear. Even with concentrated attention to emergency routes (152 miles with 2-4 lane clearance) it takes 5 plow-spreaders almost 3 hours to loop the emergency routes once, distributing approximately 82.08 short tons of salt per loop.  Covering all the streets takes 3 salt spreaders a full 6 hours and 5 salt re-fills. An average driver clears around 450 miles, plowing just over 9,000 tons of snow in a single 12 hr shift. When a storm dumps 223,000 tons of snow per depot in a single day (January storms, 2011), complete clearance can require almost 7 days of continual salting, vehicular clearance, and mechanical melting [30,31,32].  Each year the city also contracts “equipment with operators” to supplement and speed up its own snow removal [33].

Imagine the energy, the efforts, the agents, and the imports required for a snow season expanded and intensified from Halloween blizzards to April emergencies.

template_salt6_LUCOM

Figure 5  NE Imports: Cheap salt, imported from coastal mines and port-side pans, is largely available due to the post-war standardization and mechanization of bulk shipping. Image © Meg Studer

NaCl:NE Imports 

From Baltimore to Boston, over 4.5 million tons of salt arrives annually from the Caribbean, S. America, Europe, and N. Africa [34]. The efficiencies of water transport over rail and road—lower costs, less congestion, larger loads and better fuel efficiency—have been critical for more than just NYC’s barge feeder alliance. It has captured 51% of the Northeast’s de-icing market.

The instruments of modern bulk loading—mechanized belts and massive gantry cranes—enable between 2-16,000 tons/hour to be loaded into 40,000 ton cargo holds, operating with a scale and speed lacking in land transfer [35,36,37]. Often built into today’s standardized handysize and handimax vessels, these industrial loading mechanisms make any deep river or mid-sized berth into an ideal drop or pick-up point for multimodal cargo. To a certain extent, the rise of industrialized shipping has drawn production towards the sea as well, keeping the traditional and time-intensive production of salt in solar pans and evaporative pools economically viable (in Egypt, Bahamas, Brazil, etc.).

Industrial room-and-pillar salt mining, where possible, has also evolved to profit from such water-borne transport. Like the Detroit works beneath the Great Lakes, or the Gulf-Coast domes of Louisiana, most of the Northeast’s Canadian and European imports come from mining operations adjacent to or directly under-seas. From mines at ISME (Ireland), Union (UK), Morton and N. American (CA), belt loaders snake directly from production shafts to shipping berths and customized canals. While Union’s site dates from Roman and Victorian eras, the majority of the works supplying the Northeast (and all those with internal docking facilities) have been developed in the wake of post-war shipping standardization [38].  One can say that, as a driver for today’s salt market, the need for open roads has only been matched by the supply advantages of the open seas.

template_salt7_LUCOM

Figure 6  NE Backhaul: The industries and alliances subsidized by salt. Image © Meg Studer

NaCl: NE Backhaul

Salt imports to the Northeast are supported by more than just the technical ease of shipping: most trading partners/nations have trade agreements with the U.S.; more importantly, almost all receive ‘return’ goods from the East Coast’s major free trade zones [39,40].

Norden, the shipper hired by Empressa for International Salt Co, provides an interesting example. Norden’s ships run salt from Societas Punta de Lobos in Chile through the Panama Canal and north to Boston. They then turn south again, making further deliveries at Newark, Philadelphia, and Baltimore. As they unload salt, handi-max cargo holds are then re-filled with grains bound for Columbia and hard coal destined for South America. In Columbia, Norden ‘tops up’ with more coal, which is finally delivered in southern Chile, for electric generation [41].  Thus, one can speak of a trade triangle, in which salt is, in fact, the ‘backhaul’ good (that is, a second, separate cargo carried in the later leg(s) of a journey to split or reduce overall fuel costs). The Norden triangle capitalizes on salt’s inelastic demand to offset shipping costs for more lucrative wheat ($200-400/metric ton) and coal ($100-150/metric ton) [42].  In doing so, the Northeast’s appetite for clear streets becomes entangled in Chilean energy politics, subsidizing the expansion of coal-thermal power plants.

The New England trade routes partner salt with other goods. During the colonial era, the British triangulated Boston-bound salt with its production and use; Liverpool sent slaves to the Caribbean pans, salt to Boston, and, finally, imported the Colonists’ preserved cod [43].  Today, Boston’s Mediterranean salt imports constitute the ‘backhaul’ for bulk scrap headed to Eurasia and beyond: steel bound for Turkey and India, paper and cardboard bound for Chinese recycling. Thus as Boston’s largest import, salt also subsidizes Boston’s two largest exports [44].  Although less dramatic than coal politics or slave swapping, these break-bulk routes indicate just how embedded salt is in the mundane circulation of consumer packaging and re-purposed industrial resources.

template_salt8_salars

Figure 7 EMBEDDED EVENTS: Along with global goods, cumulative eons sit behind de-icing salt delivery and adjacent, immanent sourcing streams. Image © Meg Studer 

NaCl: Embedded Events and Alternate Arrays

Along with hidden transit times and subsidized cargo contracts, typical Northeast road salt engages eons. Solar evaporation—used in Egypt, Tunisia, Peru and the Bahamas—requires up to five years to produce and prep a salt harvest. New York City’s salt, mined by Societas Punta de Lobos (SPL) in Chile, ranges from 10-23 million years old [45]. Excavated from the top 60-120m Salar Grande in the Atacama Desert, these salts are merely the ‘upper crust’ of an enduring arid climate. Beneath the pure sodium chloride halites lie another 150 million years and 150m of evaporation. Northern Chile’s salt is layered with nitrates, gypsum, lithium, and copper. Providing more than just salt, the salars are anticipated to become intense sites of future, ‘digital’ competition since they are currently the largest producers (42%) of refined lithium on the planet [46].

Even older, salt from upstate NY hails from nearly 350 million years ago. The lateral veins stretched beneath the Finger Lakes to Ohio are remnants of the receding shores of Rheic and Panthalassic Oceans. Considered from the vantage point of the marginally melted blocks of a New York City blizzard, the journey of salt condenses and collapses together no less than:

  • 23 million years of evaporation: 24 days of shipping transit time: 1 day of tug/barge/truck loading/transfer time: and  12 hours min. as dispersed during 1 DSNY spreader application shift
  • 40 k tons of hard coal as the alternate cargo during Norden hauling: 40 k tons of surrounding salt during backhaul
  • 1 handimax ship @ 42.3 million ton-miles: 1 barge/tug @ 6828 ton-miles: 1 loader: 1 spreader @ 5850 ton-miles/shift and 20.2 billion BTU or 3452 barrels of oils for ocean transit; 3.078 billion BTU or 530 barrels of oil  per quarried handimax load; .75 barrels of oil per spreader shift; 24 barrels of oil per shift of mechanical-snow melter use… [47]

It’s quite an impressive effort, quite an energy sink to subsidize speed, negate climate, and enable emptiness, even at the small scale of a community district or single storm. Barring the likelihood that collectively, commercially we’d embrace the frozen stasis, this stark accounting invites the question of how we might engage novel salt strategies and scales in the immediate, anticipated winters of the Northeast. Be it sited tactics (recuperating urban melt lots or appropriating fracturing brine), alternate ecological uptake (by migrating, brackish marshes, alternate aquacultures and sodic fodder crops), or recombining logistics arrays (from Columbian coal and Bolivian lithium to re-occupying the side-rails and stockpiles of New York), let us end with this open invitation to projection; what are the alternate couplings, ‘recycling’ operations, and internal arrangements we might glean and hybridize from these salt systems and sources?  How does road salt’s industrial ecology, its extended, operational footprint, alter how we consider automotive infrastructure and its alternate futures?


headshot-grysclMeg Studer is a designer, researcher, and historian with a focus on the administrative tools of territorial construction, from popular projections to embedded, operational materials. Aside salt logistics, she has forthcoming articles on environmental accounting and climate control in antebellum Boston and a show on the aerial, global (and dystopian) cartographic imagination cultivated between WWII and Apollo-8. Meg holds MAs in history and theory from the Architectural Association and Columbia University, as well as an MLA from the University of Pennsylvania. She is currently a MA candidate in Interactive Telecommunications at New York University and leads Siteations studio.


References

[0] Industrial ecology is roughly the study of material and energy flows through industrial systems, as modeled with the tools of engineering, economics, sociology, toxicology and the natural sciences. Its’ approach endeavors to analyze and understand the emergent behavior of complex, integrated human/natural systems. See Brad Allenby, “The ontologies of industrial ecology,” Progress in Industrial Ecology 3 (1/2): 28–40 and The International Society for Industrial Ecology, accessed February 17, 2013, http://www.is4ie.org/
[1] Alex Wall, “Programming the Urban Surface” in James Corner, ed. Recovering Landscape (New York: Princeton Architectural Press, 1999) 246.
[2] Pierre Belanger, “Synthetic Surfaces” in Charles Waldheim, ed. The Landscape Urbanism Reader (New York: Princeton Architectural Press, 2006) 239-295.
[3] Kelly Doran, “Tar Sands” in John Knechtel, ed. Fuel, Alphabet City no. 13 (Cambridge, MA: MIT Press, 2009) 278-307.
[4] CLUI, “Trans-Alaska Pipeline” in Rania Ghosn, ed. Landscapes of Energy, New Geographies 02 (Cambridge, MA: Harvard U Press, 2009) 75-82.
[5] Dennis Kostick, “Table 3 Salt Produced In The United States, By Type And Product Form,” “Table 6 Distribution Of Domestic And Imported Salt By Producers In The United States, By End Use And Type” in “Salt Mineral Yearbook 2008,” (adjusted production + use volumes), USGS Minerals Information, accessed October 29, 2011. http://minerals.usgs.gov/minerals/pubs/commodity/salt/index.html#myb.
[6] R. Adams, Houston, L. and, Weiher, R., “The Value of Snow and Snow Information Services,” NOAA’s National Operational Hydrological Remote Sensing Center, accessed October 29, 2011. http://www.nohrsc.noaa.gov/technology/pdf/NOAAs_National_Snow_Analyses.pdf
[7] “Salt Mineral Yearbook 2008” (total U.S. usage compared with State volumes, note 7)
[8] Sources and Prices averaged from State DOT and municipal co-op procurement contracts (2008 adj. numbers), accessed October 29, 2011.
[9] This estimate is derived from PA’s state snow budget in comparison with its’ salt costs; For example, PA on average has spent $46 million annually on salt, but has a total snow removal budget of $196 million. “PA DOT Winter Operations Guide,” accessed October 29, 2011. ftp://ftp.dot.state.pa.us/public/PubsForms/Publications/PUB%20660.pdf
[10] H.D. Pearsall, “Salt-Water for Street-Watering” in The Builder v 53.1877: 824. (U Michigan Digitization), accessed October 29, 2011. http://books.google.com/books?id=MVYcAQAAMAAJ&pg=PA824&dq=HD+Pearsall+CE&hl=en&ei=lmCsTqChG8fq0gHftr21Dw&sa=X&oi=book_result&ct=result&resnum=9&ved=0CFQQ6AEwCA#v=onepage&q=HD%20Pearsall%20CE&f=false.
[11] Arthur Blanchard, “Dust Prevention by the Use of Palliatives.”  The American City v 8. (Buttenheim Corp: New York, 1913) 293-297. (U Michigan Digitization), accessed October 29, 2011. http://books.google.com/books?id=R6ZLAAAAMAAJ&dq=road+salt+water&source=gbs_navlinks_s.
[12] Frank W. Grierson, “The Supply of Sea-Water to London.” American Architect and Architecture v 51, n 1051. (February 15, 1896) 74-78.  (U Virginia Digitization), accessed October 29, 2011. http://books.google.com/books?id=C4lMAAAAYAAJ&dq=road+salt+water&source=gbs_navlinks_s.
[13] Cheshire, Laura. “Have Snow Shovel, Will Travel,” National Snow and Ice Data Center, accessed October 29, 2011. http://nsidc.org/snow/shovel.html
[14] Looker, et al. “Use of Sodium Chloride in Road Stabilization,” Transportation Research Board, accessed October 29, 2011. Order/abstract at http://pubsindex.trb.org/view/1939/C/122009
[15] Tiney et. al. “Progress Report of Treatment of Icy Pavements,” Transportation Research Board, accessed October 29, 2011. Order/abstract at http://pubsindex.trb.org/view/1933/C/110789
[16] Blackburn, et al. Development of Anti-Icing Technology,” NRC Strategic Highway Research Program, accessed October 29, 2011. www.trb.org/publications/shrp/SHRP-H-385.pdf
[17] State Highway extents:  “Functional System Length – 2008 Miles by Ownership” (Table HM-50) from “Highway Statistics: 2008,” Federal Highway Administration, accessed October 29, 2011. http://www.fhwa.dot.gov/policyinformation/statistics/2008/hm50.cfm
[18] State DOT and municipal co-op procurement contracts (2008 adj. Numbers), see endnote 7.  PA specific DOT/Depot numbers from “Legacy Contract No. 6810-02 Sodium Chloride (CN00030381),” accessed October 29, 2011. www.dgsweb.state.pa.us/costarsreg/docs/sodiumchloride09-10.pdf
[19] NYS production and import volumes: Dennis Kostick, “Table 2 U.S. Salt Companies By Production Capacity, Location, And Type In 2008,” “Table 12 U.S. Imports Of Salt, By Customs District” in “Salt Mineral Yearbook 2008.”
[20] “Principal Ports of the United States, 2009 update,” (Salt/bulk facilities, ownership/rental/use), Navigation Data Center, US Army Corps of Engineers, accessed October 29, 2011. http://www.ndc.iwr.usace.army.mil/data/datappor.htm
[21]  “Bulk Cargo Facilities Map,” Port of New York and Newark, accessed October 29, 2011. http://www.panynj.gov/port/bulk-breakbulk-project-cargo.html
[22] Cargill system statistics from Frank Sim’s Testimony (Cargill) in “Volume III:Section 5- Field Hearings”  in Transportation for Tomorrow. National Surface Transportation Policy and Revenue Study Commission/Bureau of Transportation Statistics, accessed October 29, 2011. http://ntl.bts.gov/lib/33000/33400/33441/final_report/volume_3_html/05_field_hearings/contente47e.htm?name=0407_minneapolis_test_bio_sims.
[23] Car count from “The official Railway Equipment Register: Private Car Owners (April 2010),” accessed October 29, 2011. Reposted by www.progressiverailroading.com/pr/graphics/pr0810c.pdf
[24] Specific delivery schedule interpolated from NYS Salt Contract Award terms, “Award Document-Contract Award Notification: Group 01800-Road Salt” (p7), accessed October 29, 2011. http://www.ogs.state.ny.us/purchase/spg/awards/0180022287CAN.HTM
[25] Connecticut delivery terms: CT 10PSX0159 Contract Document, “Exhibit A-10.Delivery” (p3 of exhibit A), accessed October 29, 2011. Search # at http://www.biznet.ct.gov/.
[26] For general urban import information search International Salt Co (ISCO) in state contracts.
For NYC specifically see “Global Market: “Estados Unidos” Societas Punta de Lobos, accessed October 29, 2011. http://www.spl.cl/english/international/index.html.
For NYC usage volumes (salt + brine) see “DSNY: Annual Report, 2009,” NYC.gov-Sanitation Publications, (Equipment/salt use/crew shifts/ melter speeds p 6, 15), accessed October 29, 2011. http://www.nyc.gov/html/records/html/govpub/sanit1.shtml
[27] See CT contract, footnote 16 for required stockpiles. See also “Bulk Stockpiles and Salt Packaging Facilities.” International Salt, accessed October 29, 2011. http://www.internationalsalt.com/logistics.html
[28] NYC depot/sheds locations as determined from annual budget requests and garage locations:
NYC Executive Budgets 08, 09,10 (requested capital for shed repairs). accessed October 29, 2011. http://www.nyc.gov/html/omb/html/publications/publications_2010.shtmlhttp://www.nyc.gov/html/omb/html/publications/publications_2009.shtml,http://www.nyc.gov/html/omb/html/publications/publications_2008.shtml
[29] “About DSNY-Garage Locations” NYC.gov, accessed October 29, 2011. http://www.nyc.gov/html/dsny/html/about/garage.shtml#.Tq3W_E_U16w
[30] NYC GIS: “community districts” (area),  “snow emergency routes,” “street center lines.” NYC Open Data, accessed October 29, 2011. http://nycopendata.socrata.com/browse?limitTo=maps
[31] Sanitation shifts, equipment capacity from DSNY Annual Report (footnote 17, reference 3). Calculation of distribution speeds and melt speeds based on best practices of driving 30 mph and Reinosdotter, et. al. “Road Salt Influence on Pollutant Releases from Melting Urban  Snow.” Water Qual. Research. Canada, 2007 · Volume 42, No. 3, 153-161 Accessed 10.29.2011.  http://www.cawq.ca/cgi-bin/journal/abstract.cgi?language=english&pk_article=352.
[32] Lane-miles/street mileage from “How Smooth are New York City’s Streets,” Fund for the City of New York (2001 report), c http://venus.fcny.org/cmgp/streets/pages/reports.htm
[33] “Agreement To Hired Equipment With Operators For Snow Removal Emergencies 2011-12,2012-13 And 2013-14 Winter Seasons” DSNY Contract Opportunity, accessed February 18, 2013. http://www.nyc.gov/html/dsny/downloads/pdf/business/82711SN00060.pdf
[34] General import information from Denis Kostick, “Table 11 U.S. Imports For Consumption Of Salt, By Country,” “Table 12 U.S. Imports Of Salt, By Customs District” in “Salt Mineral Yearbook 2008.”
Specific Trade Partnerships (Major imports only, North East only), accessed October 29, 2011:
From ownership links:
         From other:
[35] Vessel size references from “Vessel Classification,” World Trade Reference, accessed October 29, 2011. http://www.worldtraderef.com/WTR_site/vessel_classification.asp
[36]Ship sizes- from Handymax to ULCC,” International Marine Consultancy, accessed October 29, 2011. http://www.imcbrokers.com/blog/overview/p/detail/ship-sizes-from-handymax-to-ulcc
[37] “Handymax,” Wikipedia, accessed October 29, 2011. http://en.wikipedia.org/wiki/Handymax
[38] Corporate site searches (from footnote 22) confirm site/plant ages. Loading/Logistics technology were determined from web/google imagery.
[39] U.S. Foreign Trade Zones: “Maine,” “Massachusetts,”  “New York,” “Pennsylvania,” Import Administration, accessed October 29, 2011. http://ia.ita.doc.gov/ftzpage/letters/ftzlist-map.html
[40] Trade Agreements from “WTO & Multilateral Affairs,” “Free Trade Agreements,” and “Trade & Investment Framework Agreements,” Office of the United States Trade Representative, accessed October 29, 2011. http://www.ustr.gov/trade-agreements
[41] Norden Contract PR from “NORDEN news summer 2011.pdf” (2011: 3), accessed October 29, 2011. http://www.ds-norden.com/profile/nordennews/newsmagazine/
[42] Price flux range was derived from posted wheat on Index Mundi and coal from the Energy Information Administration:
[43] Kennedy, Cynthia M. “The Other White Gold: Salt, Slaves, the Turks and Caicos Island, and British Colonialism.” Historian 69, no.2 (Summer 2007): 215-230.
[44] Martin Associates, Rhode Island’s Ports: Opportunities for Growth, (2011) with Consolidated data for New England from the U.S. Economic Census Data, accessed October 29, 2011. www.dem.ri.gov/bayteam/documents/riports.pdf
[45] Smudge Studios. “Monument to the Miocene” (Geologic City Report #6) (2010). “The desertification of New York City” (2010), accessed October 29, 2011. http://fopnews.wordpress.com/2010/10/14/monument-to-the-miocene-geologic-city-report-6/
[46] Andrew Topf, “What’s Next for Lithium Mining in Chile?” Lithium Investing News, accessed February 18, 2013. http://lithiuminvestingnews.com/6129/lithium-mining-juniors-chile-rockwood-sqm/
[47] Ton-miles and feight-type energy use from “Freight Facts and Figures” (2005), Table 5-7 and 5-7M: Fuel Consumption by Transportation Mode), Federal Highway Administration, accessed October 29, 2011.  http://ops.fhwa.dot.gov/freight/freight_analysis/nat_freight_stats/docs/05factsfigures/table5_7.htm.

Infographic Sources:

Figure 01-NaCl: National Production
See Endnotes 4-8 and:
“Salt Historic Statistics,”USGS Minerals Information, accessed October 29, 2011. http://minerals.usgs.gov/ds/2005/140/
“Salt Commodity Summaries 1996-2010,” USGS Minerals Information, accessed October 29, 2011. http://minerals.usgs.gov/minerals/pubs/commodity/salt/
“Waterborne Commerce of the United States, 2008,” (Salt and Halite Shipments), Waterborne Commerce Statistics Center, US Army Corps of Engineers, accessed October 29, 2011. http://www.ndc.iwr.usace.army.mil//wcsc/wcsc.htm“Principal Ports of the United States, 2009 update,” (Salt/bulk facilities, ownership/rental/use), Navigation Data Center, US Army Corps of Engineers, accessed October 29, 2011.http://www.ndc.iwr.usace.army.mil/data/datappor.htm
Figure 02-NaCl: North-East Distribution
See Endnotes 7, 9-12 and:
“Salt Historic Statistics”
“Salt Commodity Summaries 1996-2010”
Figure 03-NaCl: NYSDOT Distribution
See Endnotes 7, 13-16 and:
Multiple State DOT/municipal contracts (2008 adj. Numbers), see footnote 7 for web-links: NYS PC61323 (Cargill), PC61940-42 (American, Cargil, N. American), PC62613-4 (American, N. American), PC63267-71 (American, Atlantic, Cargill, International)“Principal Ports of the United States, 2009 update”“American Rock Salt Case Study,” RMI Transport Management Solutions, accessed October 29, 2011. http://www.rmiondemand.com/customers/studies
Figure 04-NaCl: NYC Distribution
See Endnotes 17-20
Figure 05- NaCl: NE Imports
See Endnotes 21-23″Ocean Shipping Schedules,” (Typical liners/routes and turn-around times (region search)), Port of New York and Newark, accessed October 29, 2011. http://www.panynj.gov/port/ocean-shipping-schedules.cfm
Google Earth facilities location aerials (lat/long location):
N. American (Amherst, Nova Scotia and Gooderick, Ontario: 45.842555°, -63.656099° and 43.744905°, -81.719652°)
Union Salt (Cheshire, UK: 53.208665°, -2.518766°)
K&S:
Morton (Inagua, Bahamas: 21.000333°,  -73.571522°)
Societas Punta de Lobos (Tarapaca Terminal, Chile: -20.804084°, -70.191258°)
Salinas Diamante Branco (Areia Branca-Rio Grande do Norte, Brazil: -4.971058°, -37.128942°)
Frisia Zout B.V. (Harlingen, Netherlands: 53.187514°, 5.425555°)
Eastern/Atlantic Salt trading partners:
ISME (Carrickfergus, Ireland: 54.727687°, -5.747926°)
El Nasr Salines Co  (Sfax, Tunisia: 34.717084°, 10.747215°)
El Mex Salines Co. (Alexandia, Egypt: 31.089687°, 29.813206° and 31.096128°, 33.453041°)
Figure 06- NaCl: NE Backhaul
See Endnotes 24-28
“Ocean Shipping Schedules”
Figure 07- NaCl: Embedded Arrays and Alternates
See Endnotes  29-30
Jonathan Clarke, “Antiquity of aridity in the Chilean Atacama Desert,” Geomorphology2006.
Horacio Parent, “Oxfordian and Late Callovian Ammonite Faunas and Biostratigraphy of the Neuquen-Mendoza and Tarapaca Basins” Boletin del Instituto de Fisiografia y Geologia. 2006

Feedback: Designing The Dredge Cycle

1100 AM EDT WED OCT 31 2012

The National Weather Service’s Hydrometeorological Prediction Center issues its final official prediction for the storm, Remnants of Sandy Advisory Number 37: “…WINDS…ACCUMULATING SNOWS…AND RAIN FROM THE REMNANTS OF SANDY CONTINUE TO DIMINISH…” [1]

Yet the effects of Hurricane Sandy linger.

Homes on Staten Island, the Rockaways, and the Jersey Shore have been tossed inland by floodwaters, broken apart, or burnt by fires. Floodwaters dislodge contaminated sediments from Superfund sites [2]. The US Army Corps of Engineers sends its “Dewatering SWAT Team” to lower Manhattan, where it “removes more than an Olympic-size swimming pool’s worth of water per minute from New York’s flooded mass transit tunnels” [3]. Sand has filled streets, beaches have been thrown back at the city, and it will take months to sort, clean, and replace the sand. “That is a job so big that, in one stretch of the Rockaways alone, the process has been going on 24 hours a day, seven days a week, for more than a month — truckload after truckload of sand being poured through super-size versions of children’s toy sifters” [4]. Fifteen thousand water-damaged cars sit at a remote airport on Long Island, awaiting auction [5].

A new inlet cut across coastal Mantoloking, New Jersey by Hurricane Sandy. Image by NASA Earth Observatory

The damage wrought on the New York and New Jersey coast by Hurricane Sandy, the subsequent efforts to cope with that damage, and plans to put systems in place that could defend the coast against future storms all received significant media attention in the wake of the storm. But another topography scrambled by Sandy was much less reported, though it is essential to the economic life of the New York metropolitan area: the carefully-managed underwater contours of the harbor and its bays. After Sandy, ports along the east coast path of the hurricane were closed, including the Port of Virginia in Hampton Roads and, of course, the Port of New York and New Jersey, in large part because the underwater approach terrain leading to those ports, usually groomed by dredgers to match the lines delineated on NOAA’s navigational charts, had suddenly been rendered uncertain, potentially containing hazardous underwater debris or otherwise blocked by storm-induced shoaling. In order to re-open the ports, NOAA deployed its “navigation response teams” to urgently re-chart harbor bathymetry, in a vital act of emergency landscape measurement [6]. After the surveys were completed, the emergency dredging began, repairs to ensure that no unseen hazards would interfere with the arrival and departure of container ships, oil tankers, and the other commercial vessels plying the harbor [7].

Dredging, the very activity that restored the clean geometries of the harbor channels after the storm, is, in conjunction with a range of other sedimentary handling practices, also responsible for exacerbating the damage produced by the storm. If, as we contend, dredging constitutes a sedimentary infrastructure essential to the functioning of contemporary coastal urban systems, then the first important thing to recognize about this sedimentary infrastructure is that it is rife with feedback mechanisms. To illustrate this, we’ll turn to Jamaica Bay.


Dredging Jamaica Bay

Jamaica Bay is an isolated body of water that lies between the Rockaways and the mainland of Brooklyn, connected by a narrow gap to the main estuarine complex of the New York Harbor. It has been dredged since the mid-19th century, when private firms such as the Canarsie Railroad, White’s Iron Steamboat Company, and the Knickerbocker Steamship Company dug out small channels to facilitate their operations around the rim of the Bay [8]. Dredging in the Bay accelerated and intensified at the turn of the century, with the 1907 “Report of the Jamaica Bay Improvement Commission,” which recommended transforming the Bay from a marshy estuary (by then heavily contaminated by the waste of the burgeoning New York metropolitan area) into an enormous port, which would have been larger than Rotterdam, Hamburg, and Liverpool combined [9].

Jamaica Bay, 1898 USGS Map

The port scheme, which called for the consolidation of the Bay’s many marshy islands into two massive concrete islands and the construction of a vast array of piers, was never fully realized. Nonetheless, the plan guided decisions about the Bay for over two decades, so that by the 1930s a massive sedimentary transfer had taken place. Channels, slips, and basins — fifteen, eighteen, thirty feet deep, and hundreds of feet wide — were excavated from the shallow Bay bottom. The excavated sediments were piled onto adjacent islands and marshes, most notably being used to construct Floyd Bennett Field, an early airport that is now a component of the National Park Service’s Gateway National Recreation Area [10].

This transfer roughly fixed the current form of the Bay: a deep circular channel lines the outer edge of the Bay, separating remnant marsh islands in the middle of the tidal estuary from constructed terrain on the mainland, including massive paved tarmacs at both Floyd Bennett Field and its successor, John F. Kennedy International Airport. This is the configuration delineated by NOAA’s Navigational Charts, the configuration that the Army Corps dredges to maintain, battling continual refill from loose sediments washed in from the Bay’s watershed.

Jamaica Bay, 2011 Navigational Chart. Image by NOAA

This maintained form enables the mix of activities currently found in Jamaica Bay, including recreational boating, commercial boating, and various adjacent land uses. The maintained form is also deeply problematic, as the “dredging of navigation channels” is among the complex of factors pinpointed by scientific studies as being responsible for a sharp decline in the quality and quantity of marsh found in the Bay [11]. Surveys of the Bay’s island marshes found that over half their total area disappeared in the twentieth century. Predictions for the fate of the marshes over the course of the coming century vary, but are unified in predicting alarmingly rapid rates of collapse, often total disappearance of marsh within two decades [12]. Most of the other causes believed to be contributing to this degradation (which we’ll return to) also have human origins.

Marsh loss is not merely significant as a historical anecdote, but also because of the variety of important roles that the marshes play. Jamaica Bay was and, even with the loss, is still the largest tidal wetland complex in the New York metro area, acts as habitat for over eighty fish species, and is an important stopover for migrating birds. Because of these assets it is recognized as “a unique recreational, aesthetic, and cultural resource for New York City” [13] and “the only national park in the United States you can reach by subway” [14]. In Hurricane Sandy and other major storms, the marshes provide critical flood protection for nearby businesses and residences, slowing and reducing storm surge [15]. As most of NYC’s low-lying vulnerable population is located in the Jamaica Bay watershed (and actually predicted, by hydrological models, to become more, not less, vulnerable to storm surge if proposed barriers inside the Verrazano Narrows are built), this protective value is difficult to overestimate [16]. Moreover, not only does the anthropogenically-reorganized bathymetry of Jamaica Bay contribute to the loss of marshes which could ameliorate storm surge, but that reorganization itself has increased storm surge within the Bay, by deepening the once-shallow entrance [17].

It is important, though, as we mentioned earlier, to recognize that the blame for this situation cannot be laid entirely on the design of the channels in Jamaica Bay or on the dredging activities that maintain them. Dredge is implicated in this process, but studies suggest that a wide variety of human activities bear collective responsibility for the problem: reduced sediment inputs due to urbanization, sediment toxicity killing marsh plants which would otherwise hold sediments together and stabilize the islands, poor water quality owing to nitrogen discharges at the wastewater treatment plants that ring the Bay, boat traffic, and sea level rise resulting from anthropogenic climate change.

This suggests a second vital characteristic of dredging as sedimentary infrastructure: it can only be properly understood within the context of the wider set of human activities that manipulate sediment. Dredging is a key moment, but never an isolated moment. It is connected through the movement of sediments to a vast array of other processes and landscapes: erosion control technologies like silt fences and cellular confinement systems; dams, arresting vast quantities of river-borne sediment; urbanization, agriculture, and deforestation, all accelerating erosion; techniques of recovery, remediation, and disposal; and landscapes and other products made from the sediments collected in dredging, from new islands to decorative urns. Each of these landscapes and processes sees human activity affecting and precipitating sedimentary movement. Collectively, these manipulative acts can be understood as a cycle, analogous in scope and ambition to familiar natural cycles such as the water cycle and the rock cycle, though operating with much greater speed [18].


Quickened Geologies

We—the Dredge Research Collaborative [19] — refer to this relatively new sedimentary cycle as the dredge cycle, to emphasize the key position of the activity of dredging within this set of anthropogenically-influenced earthmoving processes. Dredging is the switching point in the cycle between erosive processes driven by gravity and uplifting forces driven by the input of energy to move sediment against the force of gravity. Dredging is also the point of the most intense and rapid movement of sediment within the cycle; if human influence over sediment is one of the ways that we behave as geologic agents, then dredging is the point of initiation for our most overt acts of artificial sedimentary geology.

But our influence as geologic agents goes well beyond the sedimentary. Within geology, biological sciences, and environmental studies, there is established awareness that human alterations of biogeochemical cycles, such as the nitrogen, phosphorous, and carbon cycles, have transformed the planet at a global and geologic scale. This awareness has recently coalesced around the notion of the Anthropocene, a new geologic era characterized by man-made planetary change. First proposed in 2000 by geologist Paul Crutzen, the Anthropocene is increasingly recognized as a useful way to understand the scale and intensity of human influence on global systems, “capitalizing on the way in which [the term] dramatizes the sheer scale of human activity,” “elemental in its force” [20]. The Anthropocene re-orders our relationship to landscape, forcing us to recognize that anthropogenic influence is pervasive and endemic, and consequently, caring for the function and resilience of landscape systems cannot be limited purely to reducing human impacts [21]. We are far too enmeshed within such systems to ever be able to extricate ourselves. Thus, wherever possible, human inputs can and should be opportunistically designed and utilized to improve upon degraded biogeochemical systems, building better and more inclusive natures.

The dredge cycle. Image by Dredge Research Collaborative

In a limited fashion, one such synthesis is currently underway in Jamaica Bay. Recognizing the degradation of the Jamaica Bay salt marsh islands complex, a complicated network of federal, state, and local entities have entered into a partnership to actively rebuild several of the bay’s most severely degraded islands utilizing sand dredged from the New York Harbor [22]. Ironically, but perfectly appropriately, the majority of the sand being used for this marsh-building project is only available as an unintended consequence of a massive earthmoving project over two thousand miles away: the Panama Canal Expansion Project.

Jamaica Bay Anthrosols. Image by Dredge Research Collaborative

The Expansion Project, which will permit the Canal’s locks “to handle “New Panamax” ships — 25 percent longer, 50 percent wider and, with a deeper draft as well, able to carry two or three times the cargo” that the largest ships that can currently transit the Canal carry — is expected to significantly “alter patterns of trade,” “mean[ing] faster and cheaper shipping of some goods between the United States and Asia.” On the East Coast, the imminence of the Expansion has meant immediate and intensive pressure on ports to “deepen harbors and expand cargo-handling facilities” to accommodate the New Panamax ships that should begin docking in 2015 [23].

For the Port of New York and New Jersey, this has translated into a massive rise in the amount of dredging done in the harbor. Before Panama began the Expansion Project, the Army Corps dredged hundreds of thousands of tons of sediment from the harbor annually; since the Expansion Project began, the Army Corps has dredged millions of tons of sediment in New York Harbor annually, in a more than ten-fold expansion [24]. This dredging surge has been composed of sandier and cleaner sediments than maintenance dredging, which typically involves more polluted silts recently washed in from upstream sources. While only a small portion of this vast new stream of sediment has been diverted to Jamaica Bay for marsh building, without the quantity and quality of material dredged in the Expansion Project, there most likely would not be a marsh rebuilding project. The same kind of globally-networked commercial pressures that are implicated in the degradation of the marsh islands are now making possible their resuscitation. These relations are typical of the dredge cycle, full as it is of feedback loops that can be directed to either accretionary or erosive ends.


Sediments of the New York-New Jersey Harbor Estuary

The marsh-building projects, as beneficial and useful as they are, represent a relatively limited example of the redirection and reconfiguration of feedback loops within the dredge cycle toward the synthesis of new functional and resilient landscapes. A broader and more creative synthesis requires, at a minimum, an expansive understanding of the larger geographic and sedimentary context of dredge operations in the Harbor estuary. In preparation for an event we organized in New York City last fall — DredgeFest NYC — the Dredge Research Collaborative undertook research intended to begin to describe such a wider context.

Like all harbors within urbanized territories, the estuary receives additional sediment from anthropogenically-accelerated erosion. The main sources for these streams of accelerated sediment are processes of agriculture and urbanization taking place within watersheds feeding the harbor (primarily the Hudson, Raritan, and Passaic). While globally other major contributors to accelerated erosion include mining and deforestation, those processes contribute minimally to the New York-New Jersey harbor estuary.

Dredging the Estuary. Image by Dredge Research Collaborative

Using tabulated data from US Army Corp of Engineers New York District [25], we mapped dredge operations in the harbor estuary from 2009 to 2012, showing both locations being dredged and locations where that dredged material was re-deposited, within the harbor and beyond.

That mapping shows that most harbor dredge material is currently applied to the HARS, or the offshore Habitat Area Remediation Site, as a remedial cap atop an underwater mountain of last century’s contaminated wastes, known affectionately as the Mud Dump Site [26]. Like the sediments being applied to construct salt marsh in Jamaica Bay, the majority of this dredge cap comes from the deepening of the harbor’s shipping channels to accommodate the larger ships associated with the Panama Canal Expansion. Once the capping of the HARS site is complete, a new deposition location for the majority of the Harbor’s dredge material will be required. Some of it will likely find its way to wetland restoration and beach nourishment projects. Other sediments will be applied to various post-industrial remediation sites around the region, typically as caps for contaminated soils on heavily toxic sites such as abandoned refineries and chemical processing facilities along the Chemical Coast. At greater distances, trains and trucks have carried loads of silt, sand, clay, and rock to sites as distant as abandoned coal mines in central Pennsylvania and the “Tire Pond” near Hartford — quite literally, a pond that was choked with millions of illegally dumped tires. Such unusual uses can be expected to account for some volume of future dredge operations. The rest is still unknown and yet to be designed.


DredgeFest NYC

This potential within the dredge cycle, the possibility of redirecting or even reinventing these feedback loops to generate new landscapes, new ecosystems, and new infrastructures, led the Dredge Research Collaborative to conceive of a participatory event series. We have observed that there is a growing interest in dredging and related landscape processes within design fields. We have also observed that this interest has remained primarily speculative, in large part because of a scarcity of working relationships between landscape architects and those actors with practiced agency in the landscapes of dredge. In an effort to grapple with these limitations, we launched our event series in the fall of 2012 with DredgeFest NYC.

Hosted by Columbia University’s Studio-X NYC, DredgeFest NYC brought together corporate practitioners, government agencies, scientists, designers, theorists, industry experts, and the public to talk about dredging and how it manifests in the New York/New Jersey region. The intent of the public event was to open up a conversation about the dredge cycle, at once documentary and speculative, while using the event as an opportunity to build connections between disparate communities and to frame new design questions. DredgeFest NYC had three main components: fieldwork and research preceding the event (products of which included both an exhibition at the symposium and on-going work with videographers Ben Mendelsohn and Alex Chohlas-Wood on a documentary about the dredge cycle), a public boat tour [27] (which visited landscapes of dredge around the harbor from Manhattan to Jamaica Bay), and a symposium, itself composed of three topical, interdisciplinary sessions (“Dredge and the Anthropocene,” “Circularity and Feedback,” and “Regeneration and Public Participation”) [28].

Volume: The relative volumes of sediments dredged in every Army Corps District that recorded a cumulative total of two million or more cubic yards of dredge activity between 2009 and 2011 [29] [left];
Disposal: Classifying the method and location of disposal for sediments dredged nationwide between 2009 and 2011. [right]
Images by Dredge Research Collaborative

Dredge and the Anthropocene asked, are there limits to an ever-expanding anthropocentric geology? The Army Corps of Engineers discussed their mounting challenges in maintaining New York’s ever-deeper Harbor, while University of Maine geologist Roger Hooke presented us with timelines quantifying the exponential growth in the amount of earth humans move per capita per year as observed through history. Ominously, there was no clear answer to the underlying question.

Circularity and Feedback investigated new and experimental methods for working with sedimentary flows, methods that attempt to grapple with current environmental challenges, waste streams and operational contingencies. From the EPA’s “Beneficial Use of Dredge” and the NY/NJ Sediment Decontamination Demonstration Programs (1994-2008), we learned that there are no established design frameworks for physically manipulating, detoxifying and transporting sediments at a regional scale. The unpredictable nature of dredging cycles and volumes, combined with other logistical uncertainties, render sustainable models of dredge decontamination choreography as yet still speculative. The underlying message here was that increased analytical and forecasting rigor is required if we are to shift from hard or static infrastructures to those that are more responsive and resilient.

Regeneration and Public Participation explored sediment manipulation as a potential platform for environmental regeneration and grassroots organization. Is there design of dredge outside of federal and corporate entities?  The growing movement of citizen gardening of oysters (for the creation of reefs to stabilize channels and improve water quality, rather than for gastronomical consumption) and community efforts to regenerate the industrial banks of the Gowanus Canal demonstrated that public participation in the dredge cycle is already happening, and offers alternative potentials to top-down design of the dredge cycle.

Over the course of DredgeFest NYC it became clear that dredging in the NY/NJ harbor, as a process and set of operations, has evolved in conceptualization from an isolated and rather simplistic proposition (a linear act of industrial engineering) toward awareness of its ever-aggregating scope and influence—towards a recognition of the broader context of the dredge cycle, though not typically articulated in those terms. The management of sediments is now matriculated through extensive regional plans and strategies that include multiple stakeholders and a variety of agendas, including community and environmental concerns [30]. Dredged material is increasingly understood as a resource, rather than a waste. Yet dredging and other dredge cycle processes are still implicated in steep challenges, including legacies of toxic sediments, logistical and economic hurdles (many options exist for the reuse of dredged sediments, but few are as cheap as disposal at HARS), compartmentalization into political and disciplinary silos, and adapting to effects induced by climate change.

Yellow Bar Hassock, a salt marsh island in Jamaica Bay currently being expanded by the application of dredged sediments. Drawings by Gena Wirth, interpreting aerial balloon photography by Gena Wirth (Public Laboratory) and Rob Holmes (Dredge Research Collaborative).

800 PM EDT MON OCT 29 2012

A mere month after DredgeFest NYC, Sandy, at this point a “post-tropical cyclone,” makes landfall in southern New Jersey, [31] having already battered the eastern coast of the United States for hours, with the area around New York harbor, including Long Island, Staten Island, the Jersey Shore, Brooklyn, and Lower Manhattan particularly hard-hit.

In the wake of the storm, the pivotal role of New York’s sedimentary infrastructures in both enabling commerce within the harbor and serving as bulwarks against and dissipaters of storm surge was highlighted, shedding new light on the urgency of the task of understanding and contending with climate change, coastal resiliency, and the dredge cycle in tandem. A wide variety of responses to the storm have been broached in the press by politicians, designers, engineers, and scientists: multi-billion dollar surge barriers permanently emplaced in the harbor [32]; home buyouts in flood-damaged areas with the intention of retreating from the most heavily impacted zones [33]; “grassy network of land-based parks accompanied by watery patches of wetlands and tidal salt marshes,” as well as “breakwater islands made of geotextile tubes and covered with marine plantings” [34]; strategically hardening infrastructures to better absorb the impact of and ride out flooding when it does occur; and “a system of artificial reefs in the channel and the bay built out of rocks, shells and fuzzy rope that is intended to nurture the growth of oysters,” “nature’s wave attenuators” [35].

If events such as DredgeFest NYC and the conception of the dredge cycle have something unique to offer in this conversation, it is recognizing the quasi-designed linkages between multiple anthropogenically-driven landscape processes, be they dredging itself, beach nourishment, the Panama Canal Expansion, wetlands both eroding and accreting, coastal development, or sea level rise and ever-increasing frequencies of intense storms. Observing and acting upon these networked material relations is at least as critical to the resilience of urban systems as dealing with any individual component in isolation. The salt marshes of Jamaica Bay shrank for a hundred years without any human intervention intended to ameliorate or reverse that shrinkage. Restoration work only began when a seemingly unconnected event in a distant country, the Canal Expansion, produced a sudden surplus of suitable sand, and engineers and scientists opportunistically seized the chance to utilize that surplus. Re-designing the dredge cycle for the Anthropocene will require observing, designing, and manipulating such feedbacks, harnessing their aggregate energy so that they strengthen rather than undermine systemic resiliency.


Brett MilliganBrett Milligan is an assistant professor in the Department of Landscape Architecture and Environmental Planning at the University of California, Davis.  He is the writer and director of Free Association Design and a founding member of The Dredge Research Collaborative.  His design and research investigations in shifting infrastructure of the Klamath River Basin were initially funded by a research grant from the Graham Foundation.

Rob Holmes is currently the visiting Bickham Chair in Landscape Architecture at Louisiana State University’s Robert Reich School of Landscape Architecture. Prior to joining LSU, he practiced landscape architecture in Virginia and taught at Virginia Tech. He is co-founder of both Mammoth, which investigates infrastructures, logistics, landscape, and architectural possibilities in contemporary cities, and the Dredge Research Collaborative, which studies human sediment handling practices in the Anthropocene.


References

[1] “Remnants of Sandy Advisory Number 37,” National Weather Service Hydrometeorological Prediction Center, accessed February 8, 2013, http://www.hpc.ncep.noaa.gov/tropical/tropical_advisories.php?storm=SANDY&adnum=37&dt=2012103115&status=remnants
[2] Emma Bryce, “Getting the Dirt on Hurricane Sandy,” Green, December 26, 2012, accessed February 8, 2013, http://green.blogs.nytimes.com/2012/12/26/getting-the-dirt-on-sandy/
[3] Esther Zuckerman, “Dewatering SWAT Team Has Been Pumping Out More than an Olympic-Size Pool Per Minute,” The Atlantic Wire, November 5, 2012, accessed February 8, 2013, http://www.theatlanticwire.com/national/2012/11/dewatering-swat-team-has-been-pumping-out-more-olympic-size-pool-minute/58692/
[4] Lisa Foderaro, “Before Rebuilding Beaches, Plucking Debris from Storm-Tossed Sand,” New York Times, January 10, 2013, accessed February 8, 2013, http://www.nytimes.com/2013/01/10/nyregion/after-hurricane-sandy-cleaning-up-sand-and-returning-it-to-beaches.html?partner=rss&emc=rss&smid=tw-nytimes
[5] Natalie O’Neill, “Long Island airport used to store 15,000 vehicles damaged by Hurricane Sandy,” New York Post, December 30, 2012, accessed February 8, 2013, http://www.nypost.com/p/news/local/aparkalypse_now_xYDeipk6gVVYFkPiM4nwzK
[6] “NOAA’s navigation assets complete primary post-Sandy assignments, remain available to assist,” NOAA Coast Survey, accessed February 8, 2013, http://noaacoastsurvey.wordpress.com/2012/11/04/noaas-navigation-assets-complete-primary-post-sandy-assignments-remain-available-to-assist/
[7] “US: emergency dredging gets underway at Rudee Inlet”, Dredging News Online, accessed February 8, 2013, http://www.sandandgravel.com/news/article.asp?v1=16546
[8] Frederick Black. Jamaica Bay: A History. (National Park Service, 1981)
[9] Jamaica Bay Improvement Commission. Report of the Jamaica Bay Improvement Commission. (New York: Martin B. Brown Press, 1907)
[10] Black, Jamaica Bay, 71-73.
[11] Alexander S. Kolker et al., “Erosion in Jamaica Bay: Causes, Questions and Sea Level Rise,” SUNY Digital Repository, accessed February 8, 2013, http://dspace.sunyconnect.suny.edu/bitstream/handle/1951/48208/Kolker-abst-2001.pdf?sequence=1
[12] Jamaica Bay Watershed Protection Plan Advisory Committee, “An Update on the Disappearing Salt Marshes of Jamaica Bay, NY,” accessed February 8, 2013, http://nbii-nin.ciesin.columbia.edu/jamaicabay/jbwppac/JBAC_NPS_SaltMarshReport_080207.pdf
[13] Ibid.
[14] Alan Feuer, “Jamaica Bay: Wilderness on the Edge,” New York Times, July 29, 2011, accessed February 8, 2013, http://www.nytimes.com/2011/07/31/nyregion/jamaica-bay-a-wild-place-on-the-edge-of-change.html
[15] Jamaica Bay Watershed Protection Plan Advisory Committee, “An Update on the Disappearing Salt Marshes of Jamaica Bay, NY”
[16] Philip Orton, “Upcoming Presentation on Surges, Barriers, and Coastal Restoration,” SeaAndSkyNY, November 1, 2012, accessed February 8, 2013, http://seaandskyny.com/2012/11/01/upcoming-presentation-on-surges-barriers-and-coastal-restoration/
[17] Philip Orton, “Jamaica Bay: Pollution, Flooding, and Human Vulnerability,” SeaAndSkyNY, May 22, 2011, accessed February 8, 2013, http://seaandskyny.com/2011/05/22/jamaica-bay-pollution-flooding-and-human-vulnerability/
[18] Dredge Research Collaborative. “Dredge,” in Bracket [goes Soft], ed. Neeraj Bhatia and Lola Sheppard (Barcelona: ACTAR, 2013)
[19] The Dredge Research Collaborative is Stephen Becker, Rob Holmes, Tim Maly and Brett Milligan.
[20] “A Man-Made World,” The Economist, May 26, 2011, accessed February 8, 2013, http://www.economist.com/node/18741749
[21] Emma Marris et al, “The Age of Man is not a Disaster,” New York Times, December 8 2011, accessed February 8 2013, http://www.nytimes.com/2011/12/08/opinion/the-age-of-man-is-not-a-disaster.html
[22] “Jamaica Bay Marsh Islands,” USACE New York District, accessed February 8, 2013, http://www.nan.usace.army.mil/Missions/CivilWorks/ProjectsinNewYork/EldersPointJamaicaBaySaltMarshIslands.aspx .  The coalition includes the US Army Corps of Engineers, The Port Authority of New York and New Jersey, National Park Service (Gateway), New York State Department of Environmental Conservation, New York City Department of Environmental Protection, the National Resources Conservation Service, the New York/New Jersey Harbor Estuary Program, the New York State Department of Environmental Conservation and the New York City Department of Environmental Protection.
[23] Henry Fountain, “Panama Adding a Wider Shortcut for Shipping”, New York Times, August 16, 2011, accessed February 8, 2013, http://www.nytimes.com/2011/08/17/science/17canal.html?pagewanted=all
[24] “Dredging Information System,” USACE Navigation Data Center, accessed February 8, 2013, http://www.ndc.iwr.usace.army.mil//dredge/drgcorps.htm
[25] “Dredged Material Management Plan-Port of New York & State of New Jersey,” USACE New York District, accessed February 8, 2013, http://www.nan.usace.army.mil/Missions/Navigation/DredgedMaterialManagementPlan.aspx
[26] “Historical Area Remediation Site (HARS),” USACE New York District, accessed February 8, 2013, http://www.nan.usace.army.mil/Missions/Navigation/HistoricAreaRemediationSiteHARS.aspx
[27] For a recounting of the tour, see Henry Grabar’s “The Dredge of a Lifetime” in The Atlantic Cities, http://www.theatlanticcities.com/jobs-and-economy/2012/10/dredge-lifetime/3483/.
[28] The schedule from DredgeFest NYC is available at the Dredge Research Collaborative website: http://dredgeresearchcollaborative.org/dredgefest/.
[29] The bulk of the nation’s dredging, it can be seen, occurs along the Gulf Coast and in the Mississippi River Valley, culminating in the New Orleans District, which, despite its small geographic scope, alone accounts for a third of the nation’s dredging activity. (The three districts shown in gray lacked data for two or three of the study years, and thus are not accounted for in the ring chart.)
[30] “Hudson-Raritan Estuary (HRE) Comprehensive Restoration Plan (CRP),” USACE New York District, accessed February 8, 2013,  http://www.nan.usace.army.mil/Missions/Navigation/NewYorkNewJerseyHarbor/HudsonRaritanEstuary.aspx
[31] “Post-Tropical Cyclone Sandy,” National Weather Service National Hurricane Center, accessed February 8, 2013, http://www.nhc.noaa.gov/archive/2012/al18/al182012.update.10300002.shtml
[32] Mireya Navarro, “Weighing Sea Barriers as Protection for New York,” New York Times, November 7, 2012, accessed February 8, 2013, http://www.nytimes.com/2012/11/08/nyregion/after-hurricane-sandy-debating-costly-sea-barriers-in-new-york-area.html?pagewanted=all
[33] Thomas Kaplan, “Cuomo Seeking Home Buyouts in Flood Zones,” New York Times, February 4, 2013, accessed February 8, 2013, http://www.nytimes.com/2013/02/04/nyregion/cuomo-seeking-home-buyouts-in-flood-zones.html
[34] Alan Feuer, “Protecting the City, Before Next Time,” New York Times, November 4, 2012, accessed February 8, 2013, http://www.nytimes.com/2012/11/04/nyregion/protecting-new-york-city-before-next-time.html?pagewanted=all&_r=0
[35] Ibid.

Aqueous Ecologies: Parametric Aquaculture And Urbanism

Aqueous Ecologies imagines a future for Willets Point, a derelict peninsula in Queens, NY, in which new ecologies, economies, and cultural identities of the city are intertwined with landscape-based solutions for wastewater management and treatment [1]. Rather than starting with a traditional masterplan, this project proposes a productive ecology of multi-trophic aquaculture (closed-loop fish farming) as a catalyst for urban development. A 50-year process for cultivating aquaculture and urbanism at Willets Point increases wildlife biodiversity and creates cultural and economic synergies over time, at both local and regional scales.

Infrastructural elements and systems for multi-trophic aquaculture—fish raceways, mussel beds and kelp groins—are designed for a range of site conditions using parametric tools. These adaptive elements serve as a polyfunctional urban underlay that supports aquatic ecologies while treating fish waste, storm water and grey water for multiple development density scenarios. The robust fertilizers that are produced from this form of waste management can be sold to regional agricultural lands and garden plots. Other profitable exports from this infrastructural system include edible kelp, mussels, and sea cucumbers, a delicacy enjoyed in adjacent ethnic communities such as Flushing Chinatown. The aim of this project is to reformulate landscape as “a sophisticated, instrumental system of essential resources, services and agents that generate and support urban economies” [2].

Aqueous Ecologies proposes wastewater infrastructure that is adaptive, polyfunctional, and publicly accessible. A variety of landscape-based solutions for the conveyance and treatment of residual aquaculture waters, stormwater, and greywater are employed throughout the site. At areas of high urban density, waters flow through hard and soft-bottom channels, from sidewalk swales to plaza basins. The alternating conditions of saturation and desiccation at these urban spaces fosters a dynamic range of recreational and commercial activities. At the littoral zone of Willets Point, the character of the landscape is quite different. Biotic succession and daily tide dynamics are evident in the expansive salt marshes, while kelp cultivation groins extending into Flushing Bay become armatures for sediment accumulation and spontaneous vegetation. Public access throughout this zone, via boardwalks that convey wastewater for treatment, allows for immersive cultural experiences.

Aqueous Ecologies offers hybrid landscapes that foster cultural identity through productive ecologies. Investment in soft and hard aquaculture infrastructure to initiate site development embeds a local economic driver in a process of urbanization, and enables unique connections to adjacent communities and regional ecologies. Willets Point can be transformed through landscape infrastructure that goes “beyond technical considerations to embrace issues of ecological sustainability, connection to place and context, and cultural relationships” [3].

Regional Sewerage and Wetlands: Combined sewer outfalls and centralized treatment plants line the coast of the East River and Flushing Bay, a low-lying area that was once an expansive system of wetlands. Willets Point is notable for its high water table and lack of centralized sewer system.


Emergence of Resilient Ecologies and Economies: The integration of different types of water at Willets Point fosters an increase in biodiversity and activates local and regional programs over time. Aquaculture becomes a foundation for an ecological urbanism.


BOARD_1

System Scenarios – Strategies for Urban Interface: A range of system, scales and orientations are explored using parametric tools. Multiple scenarios of sewerage systems  wetland locations, and building development patterns are explored.


BOARD_1

Willets Point 2060: By the year 2060, synergistic relationships between aquaculture and urbanism at Willets Point are mature: housing, commercial buildings, and streets at the core supply grey water and stormwater to the aquaculture industry, and four distinct versions of aquaculture infrastructure are deployed across the peninsula.


BOARD_1

Intertwining Biophysical and Cultural Networks: Constructed ecologies of a productive aquaculture system are generative of urban expansion, while simultaneously reactive to scales of urban development.


7-Ezban_Landscape-in-flux

Landscape in Flux – Daily Tide and the 100-Year Flood: Succession and daily tide dynamics are on display at littoral salt marshes, while civic plazas at the urban core detain and release storm and grey water, creating dynamic public spaces. The conveyance of water, waste processing, and the cultivation of aquaculture affect the development and operations of urbanism.


BOARD_1

Corrugated Ground, Elevated Aquaculture: A robust urbanism at Willets Point requires a reworking of ground conditions, in order to convey, collect, and detain water, while allowing a system of roads with multiple scales of expression.

During storm events, public activities shift to elevated civic spaces that float above temporarily flooded civic spaces. The raised infrastructure connects to existing elevated transit lines and roof gardens and allows aquaculture and wastewater filtration to intertwine at multiple levels within the fabric of the city.


BOARD_1

Sculpting Landscapes + Roofscapes: Low profile undulations in the landscape are designed to create perched ponds for recreational game fishing. Shed buildings are in dialogue with the landscape, nested into berms with roofscapes that extend the slopes of the angular landscape.  The harvest, processing, and transportation of fertilizer from the aquaculture industry is embedded in the landscape.


BOARD_1

Cultivated and Spontaneous Vegetation : Kelp thrives on aquaculture waste water and is cultivated within groins embedded in Flushing Bay, at the spatial limits of the water treatment system. The kelp can either be exported into culinary and medicinal economies, or processed into fish meal and turned back into the aquaculture system. In contrast to the cultivated kelp, spontaneous vegetation flourishes alongside the groins.  


BOARD_1

Emergent Habitat Islands: Sediment deposition and accumulation against the sides of groins and boardwalks that reach out into Flushing Bay lead to an emergent landscape of habitat islands accessible to the public.


EzbanMichael Ezban is a licensed architect and partner at Vandergoot Ezban Studio. He has taught architectural design at the University of Michigan, Virginia Tech, and the Corcoran College of Art + Design. He is currently a Master of Landscape Architecture candidate at the Harvard University Graduate School of Design.

Michael’s work engages the production of waste and contamination remediation as generative urban processes. He was a Visiting Scholar in Architecture at the American Academy in Rome where he conducted research on the ancient Roman landfill Monte Testaccio, and in 2012 his peer-reviewed essay, “The Trash Heap of History,” was published in Places. In 2013 Vandergoot Ezban Studio’s design for Great Lakes dredging regimes, as adaptive public infrastructure will be published in the book “3rd Coast Atlas,” edited by Charles Waldheim, Clare Lyster, and Mason White.


Refrences

[1] This project was produced in the Harvard Graduate School of Design Landscape Studio Core III, coordinated by Chris Reed.
[2] Pierre Belanger, “Landscape as Infrastructure,” Landscape Journal 28. (Spring 2009): 79
[3] Elizabeth Mossop. “Landscapes of Infrastructure,” in The Landscape Urbanism Reader, ed. Charles Waldheim. (Princeton: Princeton Architectural Press, 2006),176.


Wild Innovation: Stoss In Detroit

Detroit is expansive.  The culturally significant eight mile road is just that, a survey baseline 8 miles from the river’s edge, marking the boundary line between city and adjacent suburbs and towns.  The city itself is 143 square miles in area (approximately 370 square kilometers), large enough to fit all of Manhattan, Boston and San Francisco within its boundaries.  Area is a challenge in Detroit, but even more so, vacant area is a challenge.  Of the 143 square miles, twenty percent or 28 square miles registers as vacant, and thirty percent or 41.5 square miles is contained within the right-of-way.  Detroit is a city whose fabric is dominated by detached houses and free-standing buildings, making demolition possible and prevalent.  While the vacancy is concentrated in some areas, the overall pattern is unplanned, perforated and varied.

stoss-figure-0

Proposed Landscape Structure. Image © Stoss Landscape Urbanism

The voids range in scales, formats, morphologies, locations, past uses, toxicity, perception, land cover, all resulting in differing suitability for new uses.  When left relatively untouched, ecological succession occurs on vacant lands, providing measurable and valued ecosystem services.  Yet, these abandoned swaths, admirable for their reproductive and sustainable tendencies, [1] underperform culturally and socio-economically.  It makes sense to conserve some land for unhindered ecological transformation and research, but given the varied conditions and the active populations, this cannot be the only solution.  Detroit will not be left to gradual re-forestation.  Instead, a multi-pronged, multi-scalar approach must be developed, proactively both in the short- and long-term.

A Landscape Infrastructure for Detroit

The necessity of multiple interventions becomes more apparent when considering that vacant land is only one of the many challenges facing Detroit.  The eight mile road is a political boundary, but also a socio-economic divide.  The racial, economic and health contrasts are stark.  Detroit has a predominantly African-American population that faces high rates of poverty and health issues including asthma and heart disease.  There is a legacy of industrial pollution and environmental hazards, adversely affecting poor communities.  Industrial and residential areas are too close together.  The outdated infrastructure cannot support the city’s stormwater, with discharges of combined sewage/stormwater in violation of state and federal standards.  The transportation system is inefficient.  The education system is inadequate.  Entire neighborhoods lack basic services, including access to groceries and fresh produce.  The city government does not have the funds and abilities to address these issues.  The situation is complex, the extent of environmental and social justice issues pervasive.

Given the current climate, two trends emerge: landscapes are abundant and unavoidable; and past civic landscape typologies—the square and the park—are obsolete in this context. They are too passive, singular and inert to catalyze transformation.  Detroit does have squares and parks but they are underfunded, lack maintenance, and are located at the periphery, far from the areas of greatest inhabitation.  This presents the opportunity to re-think the civic landscape as a greater system with the potential to be reproductive, generative and structural. When framed properly, Detroit has three assets: land, time and people.  The city has been home to innovation throughout its history, and the next chapter is poised to address the urban landscape.

stoss-figure-8

Robust spontaneous meadow, Northeastern Detroit. Photo by Jill Desimini

Stoss Landscape Urbanism, through the writings of its founder Chris Reed and the concepts driving a number of projects, has long advocated for landscape projects that transcend form, object and pure aesthetics to embrace performance, metrics, frameworks and systems.  The firm, in moniker as well as practice, espouses landscape urbanism, “an alternative to the perceived limitations of urban design discourse and its nostalgic commitments to density and architectural ensemble as the basic medium of city making.  In the context of decreasing physical density, decentralization and sprawl, landscape has been found by many as a medium affording a unique traction on the problematics of the contemporary city” [2]. It is not inconsequential that the thinking around landscape urbanism emerges out of conditions of and design responses to the American Midwest, out of Chicago and Detroit.  It becomes logical to then test the practices of a landscape-driven urbanism in its prototypical environment — the unbounded prairie, the decentralized conurbation.

In Detroit, despite the loss of urban density, there remain strong local traditions, occupations and grass-roots initiatives embedded in the contemporary Detroit landscape; art and agricultural practices are robust.  The goal is to support these enterprises and extend their impact.  Building upon and diversifying these local practices, Stoss puts forward a landscape-driven, strategic framework to guide future types of land use and development for the city.  They make a convincing eight-point case for landscape to meet the environmental imperatives facing the city: increasing the value of vacant land, improving citizen health, and providing efficient, cost-effective, green infrastructure.

Landscapes are inevitable; if you do nothing else, landscape will re-establish itself even in the most built-up areas.  The many emerging and successional landscapes across the city are testament to this.

Landscapes are cheap — especially relative to other forms of infrastructural or urban development. Landscapes are programmed with the ability to adapt and change to different conditions, so they can require different types and lower intensities of maintenance regimes to sustain them.  They can also be tended in different ways, so that community gardeners and urban foresters alike are rendered as stewards and caretakers of public space.

Landscapes are productive and multi-functional.  They clean air and water and soil, they make urban environments healthier, they generate resources for food, energy, commerce, and habitat.  In this way, they cultivate new kinds of urban landscapes, new kinds of urban experiences, and support a wide range of social interactions and relationships.  They help build communities, they can be sites for job training and employment, and can even be economically productive.

Landscapes are effective grounds for research and experimentation.  They are sites in which new ideas can be safely and effectively tested for later application across the city and in other cities like Detroit (think of new ways to clean large-scale swaths of contaminated urban soil, for instance).

Landscapes are green.  Built properly, they reduce the amount of resources necessary to sustain the city (think of soft rainwater infiltration gardens as opposed to hard pipes and treatment plants).  But they also create a lush, rich image and identity for the city — one which competing cities would love to have.  Densely developed cities like New York and Boston simply do not have the space to allow landscapes to flourish at the scale and with the impact that Detroit does.

Landscape systems work most effectively across large scales — even regions.  So they have an ability to connect and coordinate seemingly unrelated entities (think of how rainfall in Dearborn Heights might make its way to the Rouge River and Rouge Park in western Detroit, and eventually continue through Southwest Detroit to the Detroit River and the Great Lakes).  As such, then, they have the potential to structure cities and regions.

Landscapes are enriching; they improve the health of the environment and of the people using them, and they have positive cognitive and visual impacts.

Landscapes buy time.  They change and evolve of their own accord, but they can also allow for temporary uses while other larger decisions about a site’s or neighborhood’s future are being decided [3].

The Stoss work is part of a larger planning effort for the Detroit Economic Growth Corporation and a steering committee appointed by Detroit Mayor Dave Bing and consisting of community leaders, entrepreneurs, city staff, and representatives from philanthropic foundations.  The effort is funded by the Kresge Foundation, the Ford Foundation, and the Kellogg Foundation.  It is directed by Toni L. Griffin and Hamilton Anderson Associates and includes significant contributions from Stoss, Happold Consulting, Teresa Lynch / MassEconomics and ICIC, Interface Studio, Alan Mallach and the Center for Community Progress, the Detroit Collaborative Design Center, and Michigan Community Resources, and Canning Communications.  The project began in 2010 and the plan will be published in late 2012 and early 2013.

stoss-figure-1

Figure 1  Illustrative Scenarios. Image © Stoss Landscape Urbanism

The intelligence in the Stoss piece is that it recognizes that no one solution will be able to address the complexity of issues facing Detroit; that the strategies must work across scales and time frames; that they must be productive; and that landscapes can best address concerns of environment, health and land value.

stoss-figure-2

Figure 2  Decision-Making Matrix. Image © Stoss Landscape Urbanism

The loss of value in the land rests not only in economic terms, but also in terms of perception and performance.  To get an indication of intricacy, the project tests its strategies against thirteen goals: to promote healthy lifestyles, to increase access to healthy foods, to capture and clean stormwater, to clean soil, to improve air quality, to create habitat for wildlife, to stabilize neighborhoods, to research and test new ideas, to reduce maintenance costs, to put vacant land to productive uses, to generate energy, to create jobs and job training opportunities, and to promote new kinds of social life.  Behind these goals are a number of bigger ideas about the creation of new urban form for Detroit, ideas driven by the mediums ability to address horizontal expanse, to make connections, to provide services and to evolve biophysically and socio-economically.  Ecology is at the forefront, infrastructure is embedded, environmental justice addressed and cultural perception altered.  Detroit becomes a model for a green and blue city, something to emulate rather than shun in a pervasively urbanized globe.

stoss-figure-3

Figure 3  Development Categories. Image © Stoss Landscape Urbanism

The strategies proposed operate at two levels: development and land use.  The development typologies are physical, functional and nest within land use categories. [Figure 3]  The land uses belong to the open space category and fit within a larger spectrum of land uses that include new interpretations of city center, residential and industrial land classifications.  The land use typologies push the boundaries of traditional zoning categories to include specific visions and performance metrics.  These include: blue/green corridors, innovation productive, innovation ecological, and large parks.

The name ‘development typologies’ belies the systematic nature of the proposed interventions but points to their adaptability across scale and their ability to respond to different existing conditions.  There are five broad categories: community open spaces which encompass traditional recreational and civic open spaces, ecological landscapes that create floral and faunal habitat, blue and green infrastructures which address stormwater needs citywide, working and productive landscapes that expand existing agricultural and energy operations, and transitional landscapes that celebrate the art and event installations for which the city is known.

Figure 4  Hybrid Network. Image © Stoss Landscape Urbanism

Water, or more specifically the de-engineering of the previous faulty stormwater management system, drives the proposal.  The recognition of the potential of the hydrologic infrastructure to form a landscape backbone for urban development can be characterized as a form of Aquatic agency [4] — often a driver behind Stoss projects.  Water and urbanization are interdependent and often the quality of the water resources provides an indicator of urban health.  Detroit is a flat city, with a powerful radial street grid, and a severe stormwater problem.  In a simple, yet powerful idea, these two combine, and the iconic avenues of the past — Woodward, Gratiot, Jefferson, Michigan and Grand River — transform into blue corridor/stormwater boulevards, retrofitted to convey and store excess runoff.

Figure 5  Blue and Green Framework. Image © Stoss Landscape Urbanism

They become part of a productive network that works sectionally to bring water to surface lakes, dispersed ponds and river marsh lands and parks. [Figures 4-6] Detroit has a long history of development perpendicular to the river, beginning with the French ribbon farms.  The hydrological connection is restored with the five stormwater spines.  Carbon forests and on- and off-street greenways enhance the linearity while providing buffers from automobile traffic and industry.  In addition to these corridors, large patches are aggregated for productive and ecological reserves.

Figure 6  Large Lake Typology. Image © Stoss Landscape Urbanism

The park system is adapted, with underutilized parks transitioning to fill blue infrastructure needs, and new parks and recreational centers constructed in under-served areas.  Taken together, a rich landscape network presents a long-term urban structure that is tied into the regional network, and twists Hilberseimer’s notion of urbs in horto.

Figure 7  Initial Inputs and Outputs Diagram. Image © Stoss Landscape Urbanism

The Stoss scenarios come with a necessary implementation toolkit.  The proposed vision is long-term and requires zoning, regulatory and policy changes, as well as land acquisition, partnerships and pilot projects.   The design of the project includes the visualization of the decision-making process through intricate flow charts.  The project began by understanding the potential productive futures of Detroit with an iconic diagram articulating the necessary inputs and outputs to serve the public good. [Figure 7]  Land, time, people, materials and financial resources are embedded in the matrix.  Throughout the planning process, this diagram has been mined, expanded, and improved upon to generate a series of provocative vignettes, productive frameworks and optimistic, visionary and sensitive futures for Detroit.  The definition of an urban landscape is broadened, while an exemplary landscape planning process is revealed.  Cities everywhere, shrinking or not, take notes.

A version of this article was published in The Journal of Chinese Landscape Architecture, 2013, volume 29, 206, 2. 


JillDesiminiJill Desimini is an Assistant Professor of Landscape Architecture at the Harvard University Graduate School of Design. Prior to joining the full-time faculty, she was a Senior Associate at Stoss Landscape Urbanism in Boston. She holds master of landscape architecture and master of architecture degrees from the University of Pennsylvania and a bachelor of arts in urban studies from Brown University. Her research focuses on reproductive strategies for abandoned urban lands.


References

[1] Sabine Hofmeister, “Natures Running Wild: A Social-Ecological Perspective on Wilderness,” Nature and Culture 4, no. 3 (2009): 293-315.
[2] Charles Waldheim, “Hybrid, Invasive, Indeterminate: Reading the Work of Chris Reed/Stoss Landscape Urbanism” in StossLU (Seoul, Korea: C3 Publishing, 2007): 20.
[3] Stoss Landscape Urbanism, text provided to the author, November 16, 2012
[4] Charles Waldheim, “Hybrid, Invasive, Indeterminate: Reading the Work of Chris Reed/Stoss Landscape Urbanism” in StossLU (Seoul, Korea: C3 Publishing, 2007): 21.

From Landscaping To Infrastructure: The Scope And Agency Of Maintenance

Landscape maintenance is usually seen as a collection of mechanistic techniques that let us make things the way they should be — a series of a mandatory chores for maintaining order. We are so familiar with its tools and techniques that the continual practice of landscaping is nearly rendered invisible, grabbing our attention only during the irritations of a Saturday morning leaf blowing or lawn mowing. The assumption is that by maintaining the status quo, maintenance is somehow innocuous, but these operations are not neutral and their scale is far greater than the front lawn.

Maintenance operations can be understood as the infrastructural services which ensure that the physical landscape matches our needs and desires. While maintenance is typically understood as the removal of plant matter and refuse, these activities occupy just one pole on a spectrum which ranges from the subtractive to the additive, with many forms of exchange occupying the middle ground. Landscape maintenance includes the snow plowing, channel dredging and street resurfacing to secure transportation of goods, the irrigation, fertilization and mulch which fortifies the soil for production, the “broken window” campaigns and the utility excavations, desire lines and slope bioengineering. These actions range in size from the individual, which aggregates into a vernacular, to the unifying regulation of the political landscape, and are no less fundamental than police, education or healthcare are to societal function. Their vital importance is usually only recognized in absence, when the fabric of our built environment begins to dissolve under the forces of other actors. We may take for granted the lumbering street sweeper, grumble at the rotating parking restrictions that choreograph its movement, but when the accumulation of urban detritus initiates primary succession its value is instantly recognized.  The events that maintain a landscape compose its very being, but become concealed behind the very image that they work to continually project.

The process of landscaping extends to a host of infrastructural services which collectively maintain landscape, with a massive jump in scale occurring at the institutional level.

In attempting to understand the agricultural complex of the Great Plains for example, we should consider the finite aquifers which sustain production and the fresh pavement under our tires, the commodity markets which paint the fields golden and the oil fields abroad [1]. We are usually only reminded of these components when conditions change at a pace greater than our conventional capacities: a national drought, a delayed farm bill, peak oil…. Maintenance is a constant negotiation, a revealing and arresting of landscape process, and the creation of a mediated equilibrium on which we continually rely. This line of inquiry calls into the question the identity and permanence of any landscape condition — the absurdity of treating such a dynamic medium as if it were a mute object — and illuminates the generative capacity of maintenance as a viable design instrument in the ongoing project of constructing landscape.


maintenance as an infrastructural service

By identifying the many factors that maintain a particular landscape condition — that are instrumental to its continued existence — a designer is able to consider new relationships and collaborations that might be engaged as a “maintenance palette.” This palette can be broken down into a hierarchy of geophysical, ecological and technological agents which provide the infrastructural services for the physical landscape.  Many of these agents are difficult to harness — the geophysical for example — yet are undeniable in their importance. The threat of climate change drives home the point that the spatial organization of all landscape is dependent on a specific atmospheric range. Most importantly however, is that this palette implicates a host of non-human actors, living and inanimate, as landscapers, serving to maintain landscape through their collective action.  As environmental economists attempt to bring “ecosystem services” into the market’s calculations, we might consider how expanding the public concept of infrastructure might reveal the value of these maintenance services.

The maintenance hierarchy of mowing positions wind, fire, salt-spray and flooding as the base conditions from which other regimes evolve.

Interpreting landscape through a maintenance hierarchy also allows us to consider the evolution of technology, and the scale and potential of each instrument’s impact on the conceptualization and formation of landscape:

“Technology discloses man’s mode of dealing with Nature, the process of production by which he sustains his life, and thereby also lays bare the mode of formation of his social relations, and of the mental conceptions that flow from them [2].”

From the domestication of fire to the advent of 2,4-D, the invention of the scythe to the flail mower, the modernization of maintenance technology has progressed in step with all other technological revolutions. While the English landowner once employed scores of peasants to hand cut and roll their landscape garden [3], we now have lawn tractors, Weed-n-Feed, and GMO grass seed.  As the scale of our enterprises have increased, so has the scale of our instruments and their subsequent formal and spatial effects, making the logic of our tools essential to understanding the production of landscape.

Over 30 million acres of the U.S. (1.2% of total land area) are annually mowed by Bush Hog rotary cutters for example, approximately the size of the State of Mississippi [4].  As the standard mowing attachment, Bush Hogs affect a broad range of landscapes from the rough field to the power corridor; their size, turning radius and clearance is the determining factor between marsh, field and forest across the country. Even the seemingly insignificant difference between a 2” or 4” mow height or the diversification of mowing schedule can radically affect population ecology over such a large scale [5,6]. When technology “makes our lives easier” the implication is that we get the same result with less work, but the choice of Norfolk Southern to maintain its rail easement through broadleaf herbicide, mechanical mowing, or herds of goats can yield substantially different outcomes over their 20,000 route miles [7]. By foregrounding these instruments, it becomes clear that they have far more agency than they are given credit for. Landscape appears as a dynamic collage of maintenance regimes without an obvious creation date.

Each of our tools contains a formal logic in its operation which in turn determines landscape morphology [8].

Like all infrastructure, economy of operations is of paramount importance, and thus maintenance practice appropriates the earth as a planetary yard [9]: emphasizing the economy of batch operations over detail, favoring use over idyllic expression, and containing the entropic spaces a garden excludes from its image. But rather than undermining its design potential, the analogy of the yard concretizes maintenance design in the space of everyday life and the functionality of our instruments. The desire line will disappear once it is forgotten; the logging road grow over after the timber has been extracted. Both are formally determined by the vessels they convey and the instruments that maintain them — whether that be the sole of a shoe or a 9-foot rear-mounted blade.

These large-scale maintenance operations are not only responsible for preserving the hard infrastructure which we so depend on, but also in producing infrastructure through their regular execution, such as with the deepwater shipping channel. Just as a newly clipped hedge assumes an alternate form, growth habit and schedule, the dredged shipping channel has replaced its previous bathymetry and now must be scoured regularly to function. We can witness this phenomenon in many forms of infrastructure — the river levee which must be mounded up proportionately to the depth it sinks, the beach nourishment which replenishes and regrades the shoreline to counteract the ongoing migration of sand particles down the coast. Whenever there is the perpetual re-creation of an event or condition, it can be defined as maintenance.


the generative capacity of maintenance

Apart from its importance as an infrastructural service, historically the desire to maintain a specific condition has also served as a powerful generator of new infrastructure. Looking to the massive public works campaigns of the New Deal, we can see the American Landscape remade in the name of conservation [10]. Not only did the explosion of check dams, bulkheads, windbreaks and bank armaments serve to stem the massive erosion of the era [11], they also effectively constructed new hydrologies and geomorphologies through their deployment. Simultaneously, in the quest to maintain timber resources, the U.S. Forest Service constructed an extensive fire lookout system, complete with endless miles of telephone wires, firebreaks, and roads, systematically removing all snags, pest-infested, and open-growth trees [12,13]. The subsequent effects of these actions are well understood: the maintenance of one thing radically altered the whole.

Turning to the Mississippi River, we can admire the Army Corps’ herculean engineering of floodgates and spillways at the Old River Control Complex, regulating river flow into the Atchafalaya and preventing a catastrophic change in river course which would leave New Orleans without a functioning port or fresh drinking water [14]. And while South Louisiana was once created and maintained by an annual flooding regime, we can equally admire the multitude of designers in their attempts to imagine how an equilibrium would ever be reached in such a dynamic landscape. Like a memory as it evolves through each recollection, a survey of these events illustrates the potential for maintenance to produce entirely new landscape typologies in the quest of stabilizing existing conditions.

As we begin to understand the weight of climate change — what it means to lose the very foundation of our landscape — the Sisyphean processes of maintenance may emerge as the most vital of infrastructural services and the most powerful generator of new infrastructure in our attempt to hold the places of the past in hand [15]. This does not bode well, considering the pittance American society feels maintenance deserves in tax dollars, but in effect, with every multi-billion dollar gift of Federal disaster relief, we are pledging to rebuild, to recreate what once was. Perhaps that is the American way, the future of American infrastructure.

On the front lines is the military-recreational complex of Hampton Roads, Virginia, the urban agglomeration that includes Norfolk, Hampton, Portsmouth and Virginia Beach, endearingly known by locals as “Tidewater.” The metropolitan area is regularly cited on “most vulnerable” lists due to a combination of sea-level rise, subsidence and hurricane risks, as well as the value of its numerous military bases and ports [16]. Long accustomed to replenishing its shores in preparation for the tourist season [17], the city of Virginia Beach is now seen as a model by coastal engineers after it invested in an extensive hurricane protection and erosion control system, affectionately dubbed “Operation Big Beach.”

The dredge and nourishment operations of Virginia Beach create a “landscape of maintenance,” which the region increasingly relies on as infrastructure. [18]

Like New Orleans, the city has taken a Dutch turn, bargaining that as this “community for a lifetime” sinks behind its new sea wall, it will remain able to pump all stormwater through 2000 feet of outfall pipes and into the sea. Unique to this armoring strategy, however, is that the system incorporates a healthy 300-foot width of beach to buffer storm surge before it reaches the wall, allowing its overall height to be reduced to boardwalk scale and the city to retain the latter half of its name. As a storm can eat more than 50 feet of beach in a single sitting, this “line in the sand” must now be continually maintained, making the hotel strip of Virginia Beach a major exporter of sand to the region through longshore drift [19,20].

During conventional nourishment, appropriately-sized sand is dredged from a “borrow pit” in the nearby Thimble Shoals shipping channel, making use of rigid-adjustable turtle deflectors to avoid replenishing Virginia Beach with endangered Loggerheads. The dredge is then transported to temporary offshore pump stations and piped as a slurry onto the beach, where it is graded by dozers. The operation seems rather straightforward, yet too steep a grade will trigger riptides and an incorrect grain-size may cause the beach to slip away, annulling its marriage to the base fill. Local coastal engineer Phil Roehrs recalls a particularly “bad batch” one year, which remained a muddy mess for weeks, but also the delight that beach-goers experience while witnessing the spectacular operations [21]. The whole process is not unlike a new layer of backyard mulch, but at a scale which we can only understand as sublime.

And as we reflect on the maintenance sublime, we can admire the Dutch, who have taken mega-nourishment to the next level of operations with the construction of the zandmotor. By unloading 28 million cubic yards of sand all at once [22] (in comparison to Big Beach’s 3-4 million cubic yard biannual replenishment) [23], the zandmotor reaches an economy of scale by building a scaffold of dredge over a kilometer into the sea, allowing hopper dredgers sufficient berth to “rainbow” their slurry directly onto the shore, and thereby reducing the costly grading otherwise required at the end of the pipe [24]. At its core, the zandmotor appears to be a simple calculation: that through the economy of scale, the never-ending demand for sand will be met at less cost — and certainly the method of delivery accomplishes this goal for approximately half of the cost of Big Beach [25] — but central to the strategy of mega-nourishment is the assumption that the sand will eventually be distributed across the entire length of the coastline, graded by force of the ocean.

The scale of experimental infrastructural services such as mega-nourishment can be understood as the maintenance sublime, with the Zandmotor being a particularly striking representation. [26]

This detail is relevant in that it internalizes the infrastructural service of longshore currents as an integral part of maintaining the coastline and as part of a broader trend that attempts to exploit the actions of other non-human actors in landscape maintenance. Other such non-human techniques range from the domestication of soil microorganisms at the Battery Park and Boston Greenway Conservancies [27] to the increasingly common herds of urban goats that now mow our infrastructural easements and vacant lots, from the sewage-treating, storm-buffering swamp restoration in Bayou Bienvenue [28], to avian seed-dispersal on a New Jersey landfill restoration [29]. To maintain is to enable a condition to continue to be, and is therefore as diagnostic as it is evolving. Maintenance is essentially an assertion, a continual curation, an assemblage of alliances in the construction of landscape. It emerges in response to both predicted and unforeseen processes, and has the potential to effect change at a larger scale than is typically available to designers.

“Landscape interventions that get away from massive initial infusions of capital, instead focusing on management and enabling agency among valued actors is one promising way forward for theoretical development and intervention in the landscape” [30].

While landscape architects attempt to reclaim infrastructure design, we might also consider how maintenance may become multi-functional, regenerative, and adaptive, while also being uniquely within our professional realm.


A version of this article has been published in University of Virginia’s design journal Lunch8: Futures for Sites Unknown.


Michael Geffel is a recent MLA graduate of the University of Virginia and maintains LNDSCPR blog which broadcasts design experiments and research on the generative capacity of landscape maintenance. His research is organized around three themes: maintenance as infrastructural service, as design activism, and as novel ecology, with specific interest in how maintenance is situated within the context of urban metabolism, shrinking cities, and the anthropocene. He is currently working with the City of Richmond in developing alternative mowing operations for municipal easements and vacant lots.


References

[1] Wil S. Hylton, “Broken Heartland: The Looming Collapse of Agriculture in the Great Plains,” Harpers Magazine (July, 2012), 25-35.
[2] Karl Marx, Capital: A Critique of Political Economy, ed. Friedrich Engels (New York: Random House, 1906), 406.
[3] Martin Hoyles, “English Gardens and the Division of Labor,” Cabinet 6 (Spring, 2002), accessed September 27, 2012, http://cabinetmagazine.org/issues/6/hoyles.php.
[4] “Bush Hog Rotary Cutters,” Bush Hog, accessed November 11, 2012, http://www.bushhog.com/product-line/rotary-cutters/single-spindle-rotary-mowers.html.  Calculations performed by author.
[5] Jean-Yves Humbert, et al., “Impact of different meadow mowing techniques on field invertebrates,” Journal of Applied Entomology, 134 (2010): 592–599.
[6] Oldrich Cizek et al., “Diversification of mowing regime increases arthropods diversity in species-poor cultural hay meadows,” Journal of Insect Conservation 16, no. 2  (2012): 215-226.
[7] “Norfolk Southern Corporate Profile,” Norfolk Southern Corp., accessed January 12, 2013, http://www.nscorp.com/nscportal/nscorp/Media/Corporate%20Profile/.
[8] Operable dimensions developed from Lowe’s and other merchant websites.
[9] French landscape architecture seems to be far ahead of Americans in the ability to merge landscape practice with design with many precedents to draw inspiration from (Parc du Sausset, Jardin en Mouvement, Chemetoff’s stakes, Simon’s mowing, etc.), but it isGilles Clément above all who has fused the two into a distinct professional model. Clément’s concept of a planetary garden is certainly an ideal in which many have found hope, but my position is that like the yard, the majority of landscapes are formed and maintained through utility.
[10] To save, preserve, keep in existence, — essentially the same as maintenance.
[11] U.S. Civilian Conservation Corps, Hands to save the soil. Prepared in conjunction with the U.S. Soil Conservation Service (Washington, D.C.: United States Government Printing Office, 1938).
[12] U.S. Civilian Conservation Corps, Forests Protected by the CCC, Prepared by the Forestry Division of the CCC (Washington, D.C.: United States Government Printing Office, 1938).
[13] Harry Raymond Kylie, CCC Forestry, (Washington, D.C.: United States Government Printing Office, 1937).
[14] U.S. Army, Corps of Engineers, Geological Investigation of the Atchafalaya Basin and the Problem of Mississippi River Diversion, prepared by Waterways Experiment Station in Vicksburg, Mississippi under the general supervision of Harold N. Fisk, Ph. D., Consultant (Washington, D.C.: United States Government Printing Office, 1952).
[15] To maintain, from Middle French, is literally to hold in hand.  This etymological root can be read in two ways: as the total control of an object, such as when we hold a coin, or as alliance, such as when we walk with another subject “hand in hand.”  Both interpretations can be read in maintenance practice.  While the former is the typical connotation, I of course prefer the latter.
[16] R. J. Nicholls,  et al. (2008), “Ranking Port Cities with High Exposure and Vulnerability to Climate Extremes: Exposure Estimates”, OECD Environment Working Papers, No. 1, OECD Publishing, accessed January 12, 2013,http://dx.doi.org/10.1787/011766488208 (2008). While many of these list seem entirely arbitrary, the ongoing risk assessment performed by the OECD is perhaps the most legitimate reflection of vulnerability, placing Virginia Beach 19th in the world (4th in the U.S.) of cities ranked in terms of assets exposed to coastal flooding in the 2070.
[17] David R. Basco and Christopher B. Colburn, “The State of the Region’s Beaches” Old Dominion University, Regional Studies Institute (August, 2006): 6
[18] Image adapted from Army Corps maps and diagrams found in U.S. Army, Corps of Engineers, Coastal Engineering Studies in Support of Virginia Beach, Virginia, Beach Erosion Control and Hurricane Protection Project, Reports 1-3. Quanties as reported by Basco, “The State of the Region’s Beaches.”
[19] U.S. Army, Corps of Engineers, Coastal Engineering Studies in Support of Virginia Beach, Virginia, Beach Erosion Control and Hurricane Protection Project, Reports 1-3, By Mark Hansen, Norman Scheffner, Coastal Engineering Research Center (Washington, D.C.: United States Government Printing Office, 1990).  Although the design changed from this publication in response to community complaints (namely the height of the proposed sea wall) leading directly to the expansion of beach infrastructure, the system design remains essentially the same.
[20] Phil Roehrs, Inverview by Kristina Hill, Ph.D., Michael Geffel, Nate Burgess, Rachel Stevens, and Aja Bulla-Richards, Virginia Beach Department of Planning & Community Development, April 20, 2012.
[21] Roehrs, Inverview.
[22] “Facts and Figures,” De Zandmotor., accessedApril 16th, 2012 http://www.dezandmotor.nl/nl-NL/de-zandmotor/feiten-en-cijfers. Conversion to yards performed by author.
[23] Basco, 9.
[24] Joop van Houdt, ZANDMOTOR-luchtfoto 11 april, Source: Rijkswaterstaat Zuid-Holland, Rotterdam. Digital Image. Available from: Flickr, http://www.flickr.com/photos/zandmotor/5615663275/in/photostream (accessed August 10, 2012).  Construction sequence as documented by the Zandmotor Flickr
[25] “Questions and Answers.” De Zandmotor.. Conversion to dollars performed by author.  Comparison of unit cost was calculated by dividing the total cost (including planning and management) by the total quantity of sand.  The Zandmotor cost $3.37/cu yd while average replenishment at Virginia Beach ranges from $5-7/cu yd as also reported in “The State of the Region’s Beaches” by Basco and Colburn
[26] Joop van Houdt,, Zandmotor vlucht-28 29-11-2011, Source: Rijkswaterstaat Zuid-Holland, Rotterdam. Digital Image. Available from: Flickr, http://www.flickr.com/photos/zandmotor/6466936697 (accessed April 10, 2012).
[27] T. Fleisher, telephone interview by Author, August 3, 2011.
[28] Sarah K. Mack, et al., “Wetland Assimilation: Climate Change Adaptation and Restoration in the Mississippi Delta,” (proceedings of the Water Environment Federation, Sustainability 2008), pp. 830-858(29)
[29] George R. Robinson and Steven N. Handel, “Forest restoration on a closed landfill: rapid addition of new species by bird dispersal,” Conservation Biology 7, no. 2 (1993): 271-278.
[30] Brian Davis, “Dog Philosophy and Maintenance Manuals,” Landscape Archipelago (September 10, 2010) http://landscapearchipelago.com/2010/09/20/dog-philosophy-and-maintenance-manuals/ 

Made In Australia: The Future Of Australian Cities

The Australian population is increasing at a rate of one person every 84 seconds. All of Australia’s major cities; Brisbane, Sydney, Melbourne, Adelaide and Perth are forecast to double in population by mid-century. The Australian Bureau of Statistics (ABS) forecasts that by 2101 there could be 62.2 million Australians [1]. Taking this figure seriously means planning for an extra 40 million people by century’s end. And yet, the current collection of Australian planning documents go no further into the future than 2030 and only plan collectively for a mere 5.5 million additional people. There are (theoretically) some 35 million future Australians unaccounted for. Moreover, the planning that does exist is fragmented across state jurisdictions and subject to the short-term capriciousness of the 3-4 year political cycle. There is no national long term plan(ning) for the future of Australia’s settlement patterns.

WellerBolleter_Australia

All images by Richard Weller and Jullian Bolleter

This article offers a synopsis of the results of a two-year research project conducted through the Australian Urban Design Research Centre (AUDRC) regarding Australia’s future settlement patterns [2]. The project was conceived to encourage and inform broad public debate, influence planning policy settings and help foster long-term consideration of infrastructure spending from a national perspective [3]. It also proposes that landscape architects can speak to such large scale, long-term issues and add a much-needed perspective on strategic, long term urban design and planning. In order to prepare for future population growth, we argue for the promotion of population decentralisation through the application of broadband telecommunications and high-speed rail to create viable megaregions and in so doing enable Australia’s existing cities to avoid what would otherwise appear to be their inexorable slide toward becoming megacities sometime this century.

The primary reason for avoiding megacity status (cities of over 10 million people) is that despite their allure for tourists, designers and economic theorists, cities with very large populations rate poorly in global livability assessments [4]. For example, Los Angeles—a city that bears many similarities to Australian cities albeit at a larger scale—is currently ranked 44th in the Economist’s ‘Global Liveable Cities Index’. Similarly ‘great’ cities such London or New York come in at 53rd and 56th respectively. On the contrary, Melbourne is ranked 1st, Sydney 6th, Perth 8th and Adelaide 9th. The average population of the top ten most liveable cities on earth is 1.7 million. Although the rankings can be disputed and the variables are many, size it seems, does matter [5].

australia base6

Figure 1 Cities and their 2056 Population Projections

The method and narrative of this research is this: first we map the spatial implications of ABS (high) population projections for each of Australia’s existing major cities. The ABS forecasts that in 2056 Brisbane could be a city of 5.7 million people, Sydney 7.6 million, Melbourne 7.9, Adelaide 1.8 and Perth 4.2. (Figure 1) By mapping these numbers onto each city in terms of their current infill and greenfield development targets we conclude that by mid-century, if not before, these cities will have reached their limits [6]. By ‘limits’ we mean the point at which their global livability ratings begin dropping due to infrastructure overload, environmental despoliation, congestion and social inequity. As now recognised by the federal government through its newly formed agency, ‘Infrastructure Australia’ (IA) the infrastructure of Australia’s major cities is already at capacity or overloaded [7].

Furthermore, population growth is now routinely blamed for problems in Australian cities and the community generally resists any attempts by planners to increase density. Around the nation the average target for infill development is 60 per cent of all future development and yet typically only 30 per cent is achieved. Much of this 30 per cent is comprised of small poor quality projects whereby individual home owners ‘cash in’ by building a second house in the backyards of quarter acre lots and in so doing erase the open space that made suburbia attractive in the first place. Despite this practice, Australian cities predominantly continue to sprawl and are thus increasingly committed to individual forms of mobility based on uncertain energy futures. It is true, however, that if well planned, increased density along major transport corridors, at transit hubs (Activity Centres) and around the edges of public open space millions of people could beneficially be added to Australian cities. But, according to our calculations, even if those areas were developed to higher densities so as to meet Australia’s forecast growth, there comes a point in time when those cities will have reached capacity beyond which further development is deleterious. We estimate that time to be towards the middle of the 21st century.

Figure 2 Areas for development

Figure 2 Areas for development

Accepting the likelihood that Australia’s existing cities will reach capacity by mid century—if not before—we then subtract the estimated total number of people forecast to be in these cities (42.5 million) by 2056 from the 2101 projection of 62.2 million. This leaves approximately 19.7 million people still unaccounted for. We then explore the question of where these people should best live through a process of mapping the nation’s landscape through the application of a set of key criteria. Whilst recognizing that the question of future settlement patterns can not be entirely reduced to an objective method, by scoring each criterion in relation to the national landscape we have been able to arrive at a hierarchy of landscape suitability. The key criteria analysed as determining the development potential of the nation’s landscape were: water availability, food proximity, climate (now and into the future), renewable energy potential, existing infrastructure, proximity to international markets, employment potential, natural amenity, cultural amenity, liveability indices, benefit to indigenous Australians, development feasibility, strategic military locations, humanitarian potential and national symbolism. Of course, each of these criteria is highly debateable but, be that as it may, we have been able to render our results transparent, accountable and most importantly, debatable with clear terms of reference.

fig 3 Landscape Attribute Mapping

Figure 3 Landscape attribute mapping

The method leads us to prioritize major development proposals for the southeast and the southwest of the continent. (Figure 2,3,4) The southeast is defined as an area stretching over 1300 miles from Brisbane in the north to Melbourne in the south, while the southwest is defined as 400 miles of the Swan Coastal Plain from Geraldton in the north to Busselton in the south. In these regions, we argue for the creation of megaregions, not megacities. There are approximately 40 megaregions in the world, the most famous of which is the economic and cultural powerhouse of Bos-wash (Boston to Washington) ‘discovered’ by Jean Gottman in 1961 in his study of the urban corridor from Boston to Washington in the Northeastern United States [8]. Following Tim Gulden, Richard Florida defines megaregions as contiguous lighted areas with more than one major city or metropolitan region, which produce more than $100 billion in LRP (Light-Based Regional Product) [9]. To date there are no megaregions in Australia.

figure 4 East and West Coast Megaregions

Figure 4 West Coast and East Coast Megaregions, the landscapes best suited to absorbing Australia’s 21st century population growth

The development of megaregions requires the economic and cultural dynamism of large cities but also relies on constellations of smaller cities and towns. Joel Kotkin argues that, in the discourse of megaregions, the economic role played by smaller cities and towns has been somewhat overlooked [10]. Referring to a McKinsey Global Institute study, Kotkin notes that small cities (many under a million people) are responsible for more than half the world’s growth and, in the case of the United States, some 70 per cent of GDP [11]. Not only are small to mid-sized cities economically effective, they also offer their citizens a high quality of life insofar as they are relatively free from the social and environmental problems that typically beset large cities. For the middle classes, the lifestyle of choice seems to be: do business with the big city and visit when you will, but live in a healthier, more affordable, less congested and smaller one.

The populous megaregion should not just be seen as a large-scale development opportunity. Megaregional planning suggests a new conception of integration between landscape systems and infrastructure. A megaregion is best understood as a large-scale hybridisation of culture and nature, whereby the ecosystem provides the lineaments of settlement, where productive landscapes are responsibly cultivated, and renewable energy is harvested. This is not a platitude; this conception of the megaregion as a sophisticated, synthetic ecology is important, for it marks a departure from the historical image of nature as a mere backdrop to, or resource for the city. As Peter Calthorpe points out “[m]ore than standalone ‘sustainable communities’ or even ‘green cities’ we now need ‘sustainable regions’— places that carefully blend a range of technologies, settlement patterns and lifestyles” [12].

This conception also marks a departure from 20th century landscape planning from when Ian McHarg typically saw the city as a scourge on the landscape. In the emerging megaregions of the 21st century, people and their infrastructures could be the agents of stewardship. Here, we bring McHarg’s contempt for the city full circle. Whereas the dominant discourse of the megaregion to date has been one of economic optimisation, we are now advocating an economic and an ecological vision of megaregional development.

figure 5 New City 1_WellerBolleter

Figure 5 New City, East Coast Megaregion.

figure 6 New City 2_WellerBolleter

Figure 6 New City, East Coast Megaregion.

Neil Chambers captures this philosophical shift well when he writes, “[t]he end goal would be to have this revitalised region support tens of millions of people while producing natural niches for multiple ecosystems of native plants and animals to flourish and abound, where agriculture, infrastructure, and power production is integrated into nature in a way that enriches rivers, forests, economics, and communities…Biologists, engineers, ecologists, architects, zoologists, designers, hydrologists and a host of other disciplines would need to work together to restore multiple eco-zones” [13].

Technology and human nature is never so benign, but the worldview that human agency can be a constructive rather than destructive part of bioregions is the philosophical prerequisite for new material practices. Building on this premise, Harvard landscape ecologist Richard Forman has studied the range of ways in which human settlement patterns grow and their various impacts on the ecosystem. Forman’s conclusions support the development of megaregions of satellite cities, as opposed to the further sprawl of existing cities or linear development along roads [14].

In addition to people, the key to creating megaregions is high-speed telecommunications and high-speed rail [15]. With high speed rail and broadband telecommunications people can spread out but stay culturally and economically connected. By ‘spread out’ we don’t mean regional sprawl, we mean new, innovative cities designed in accordance with their landscape conditions that offer a diversity of lifestyle choices. (Figures 5,6,7,8)

High-speed trains over the scale of a megaregion make best sense when they stop no less than every 60 miles or so. When we apply this principle to the landscapes identified as best suited to megaregional consolidation we conclude that there could be a series of 17 new towns in the southeast of Australia and 8 new towns in the southwest. (Figure 9, 10) If, for argument’s sake 19.7 million people were to be divided evenly across these new cities then 25 new cities of circa 800,000 in each is the resultant distribution [16].

figure 7 New City 3_WellerBolleter

Figure 7 New City, West Coast Megaregion. 

figure 8 New City 4_WellerBolleter

Figure 8 New City, West Coast Megaregion. 

The population and immigration debate in Australia is vexed. On a recent visit to Australia the renowned population biologist Professor Paul Erlich remarked that Australians are “way beyond” the landscape’s carrying capacity and that in the future they “might have to evacuate” [17]. On the contrary, Harry Triguboff, a successful developer, has remarked that Australia should become a nation of 100 million [18]. Both these extreme positions seem inflammatory. For the purposes of this research we have accepted that in order to offset the nation’s aging population and supply its labour market Australia is almost certain to continue to grow for most, if not all of the 21st century.

Given that, the question at hand is not whether this growth is good or bad but how best to direct it. For us, accommodating population growth in a strategic and sustainable manner is a matter of spatial planning: a matter of landscape architecture at a large scale. As the nation’s preeminent demographer Professor Graeme Hugo says “…in the light of emerging environmental, economic and social trends the question must be asked as to whether, in a climate change context, the current settlement system will deliver the most sustainable, efficient and liveable outcomes for Australians over coming decades[19].

To date Australian cities have been able to sprawl more or less unabated, but as sprawl becomes increasingly unsustainable and our major cities reach liveability tipping points, decentralisation is not a case of Arcadian planning theory so much as a looming economic and social necessity. On this, Sir Peter Hall is unambiguous: “society can have already overgrown cities getting bigger and bigger…or it can have regional planning” [20].

Landscape architecture in the late 20th century turned away from the instrumentality of ‘regional planning’. We think it is time to reclaim this territory and do so in a way that is part of a larger creative project of ecologically reorganising human systems.


Acknowledgements

Thank you to Steph Carlisle and Nick Pevzner for their helpful reviews and editorial development of this article.


RichardWeller

Richard Weller is the Martin and Margy Meyerson Professor of Urbanism and Chair of Landscape Architecture at the University of Pennsylvania. Formerly he was Director of the Australian Urban Design Research Centre (AUDRC) and the design firm Room 4.1.3 known for the controversial National Museum of Australia. In addition to three books regarding his design and planning work, he has published over 70 papers on the intersection of ecology, art and design and given hundreds of public lectures around the world. Throughout his academic career he has received a consistent stream of international design competition awards at all scales of landscape architecture and urban design and was honored with an Australian National Teaching Award in 2012. Professor Weller’s current research concerns global conflict zones between rapid urbanization and biodiversity.

Julian Bolleter

Dr Julian Bolleter is an Assistant Professor at the Australian Urban Design Research Centre (AUDRC) at the University of Western Australia. His role at the AUDRC includes teaching a master’s program in urban design and conducting urban design research and design projects. Since graduating in 1998 Dr Bolleter has practiced as a landscape architect in Australia and the Middle East on a diverse range of projects. In 2009 he completed a PhD that critically surveyed landscape architectural practice in Dubai and advanced scenarios for Dubai’s proposed public open space system. Julian and his colleague Richard Weller have recently completed a book entitled ‘Made in Australia: The Future of Australian Cities.’ The book scopes the urban implications of Australia’s population reaching 62.2 million by 2101.


Notes

[1]  Australian Bureau of Statistics. “Population Projections, Australia, 2006 to 2101.” Updated on 4/9/2008. http://www.abs.gov.au/Ausstats/abs@.nsf/mf/3222.0
[2]  This research was published in March 2013 by the University of Western Australia Publishing (UWAP) under the title ‘Made in Australia: The Future of Australian Cities’ by Richard Weller and Julian Bolleter.
[3]  The research has received significant attention from the national media with over 15 radio, television interviews and newspaper articles having occurred in the first 4 weeks of publication. Ignoring for a moment the media’s attraction to ‘big picture’ futures, the response has been both positive and serious, confirming a proactive role for landscape architects as agents of change.
[4]  The Economist. “Liveability Ranking, The Economist Intelligence Unit’s World’s Most Liveable Cities Index.” Assessed on 3/12/2013. http://www.economist.com/node/21528162
[5]  The top ten most liveable cities according to the Economist and their population sizes are: 1. Melbourne (4 m), 2. Vienna (1.7 m), 3. Vancouver (0.5 m), 4. Toronto (2.5m), 5. Calgary (1.1m), 6. Sydney (4.6m), 7. Helsinki (0.5m), 8. Perth (1.7m), 9. Adelaide (1.2m), 10. Auckland (0.4m).
[6]  Averaged across Australia’s capital cities planning policies the infill to greenfield development ratio is 60 – 40 per-cent respectively. Typically, only 30 percent infill development is achieved.
[7]  Infrastructure Australia. “Homepage.” Accessed 3/20/2013. http://www.infrastructureaustralia.gov.au/
[8]  Gottman, J. Megalopolis: The Urbanized Northeastern Seaboard of the United States. New York: Twentieth Century Fund, 1961
[9]  Florida, Richard. Who’s Your City. How the Creative Economy is Making Where to Live the Most Important Decision of your Life. New York: Basic Books, 2008.
[10]  Koetkin, Joel. “Small Cities are Becoming a New Engine of Economic Growth.” New Geography (2012) , Accessed 1/18/2013. http://www.newgeography.com/content/002817-small-cities-are-becoming-a-new-engine-of-economic-growth
[11]  McKinsey Global Institute. “Urban World: Mapping the Economic Power of Cities.” March 2011. Accessed 1/18/2012. http://www.mckinsey.com/Insights/MGI/Research/Urbanization/Urban_world
[12]  Calthorpe, Peter. “Urbanism Climate Change.” In Sustainable urbanism and Beyond: Rethinking Cities for the Future, edited by Tigran Haas, 14-18. Rizzoli, New York, 2012.
[13]  Chambers, N. Urban Green: Architecture for the Future. New York: Palgrave and Macmillan, 2011.
[14]  Forman, Richard T. Urban Regions: Ecology and Planning Beyond the City. Cambridge: Cambridge University Press, 2008: 210–222.
[15]  Australia is currently building a 36 billion dollar national broad-band telecommunications network and studies into the feasibility of high speed rail for the south eastern coast are underway.
[16]  Of course, in reality development would be uneven but this even distribution serves as a diagram of population decentralization.
[18]  Unlike America which is a similar sized continent and accommodates over 310 million people, only 6 per cent of the Australian landmass is arable. Along with an additional 61 per cent of the land which is capable of supporting a thin distribution of livestock, the Australian landscape yields in toto enough food for 60 million people. In 2002 the Commonwealth Scientific and Industrial Research Organisation (CSRIO) concluded that Australia had enough food, water and energy to sustain 50 million people.
[19]  Hugo, Graeme. “Population Distribution and Internal Migration,” in, A Greater Australia: Population, Policies and Governance. Melbourne: Committee for Economic Development of Australia (CEDA), March 2012: 89.
[20]  Hall, P. Cities of Tomorrow. 3rd Edition, Carlton, Victoria: Blackwell Publishing, 2002:16.

Rethinking Infrastructure

Infrastructure underlies and shapes urban growth, yet exists outside the realm of many design discussions. As landscape advocates and practitioners argue for a central role in the design of cities, many are starting to ask, how can a focus on landscape transform traditional conceptions of urban and regional infrastructure?

Reconsidering The Underworld Of Urban Soils

Look down. If you are in a city or large town, below you is a vast network of hidden systems that support your life: pipes that carry natural gas, potable water, stormwater, sewage, and communications wires. These pipes rarely come to mind, but we agree that their operation is for the common good, that survival is not possible without them, and that armies of workers should keep them running. Surrounding those pipes are soils that are equally critical to our existence but to which we give much less attention. If we truly understood the delicacy of soil as a dynamic living system integral to the health of our towns and cities, our neighborhoods and families, we would be more cautious about how it is perceived, treated, and protected. Healthy soil performs important functions such as sequestering CO2, mitigating stormwater runoff, supporting plant life, and sustaining the microbial populations that form the basis for all living things. So essential and complex are the conditions for soils in more developed areas that a new branch of science has arisen and is now being intensively pursued: the science of urban soils.

The Teardrop Park site had no existing soil, so all planting soil was imported. Special bracing allowed concrete to be installed before soils, which prevented compaction of adjacent 3’ deep plant beds. Photo by MVVA

The Challenges of Urban Soils

Urban soils are are naturally-occurring soils that have been disturbed by development in a way that affects their functioning and properties. Urban soils are distinguished by a number of similar features: Their horizons (the natural vertical order of soils) have become jumbled by excavation. This makes urban soil horizons confoundingly diverse; one layer may be hospitable, but adjacent layers may not be, creating abrupt changes that can cause impermeable interfaces. Soil structure (the balance of solids and pores) has been crushed out of existence by mechanical compaction that chokes off water and air exchange. Organic matter (the source of plant nutrients) is low or missing from lack of replenishment, and this imbalances the soil biological community (bacteria, fungi, nematodes, arthropods, earthworms, insects, and more). Soil volumes that are important for plant health decrease because of interruptions from urban debris such as construction waste and rocks. Finally, the predominance of pavement separates soils from natural inputs such as nutrient-rich leaf litter, and this separation causes the nutrient cycling system to slow or shut down.

In the urban environment, soils are likely to be sealed off from the agents that build healthy soil—including wind, precipitation, ice, temperature, gravity, and mineralization—which frequently have been replaced by anthropogenic processes detrimental to soil functioning. Urban soils often become defined by human activities and land use histories at a particular location rather than by the continuum of geologic processes. This disrupted order makes urban soils particularly challenging to analyze, manage, and construct.

Soil depths and formulas were calibrated for each planting condition at Teardrop Park. Lawns have 18” of compaction-resistant soil while plant beds have highly organic, less sandy soil. Photo by Paul Warchol

Urban Soils in the Service of Stormwater Management

Urban soils have the potential to be an important partner in stormwater management, use, and protection. The Natural Resources Conservation Service has recognized that soils with good infiltration and permeability can significantly reduce stormwater runoff rates and volumes that might otherwise overwhelm and impair the performance of the chain of water bodies that sustain our water supplies and the ecosystems that are necessary for healthy living [1]. Good infiltration reduces runoff by letting water soak into soils before it builds up to damaging volumes and velocities that would erode topsoil and carry both silts and pollutants to waterways. Permeability influences how quickly absorbed water drains through soil to useful depths for plants and recharge. Water that reaches root zones reduces irrigation needs. Some soil can filter toxic compounds or excess nutrients by holding them, degrading them, or otherwise making them unavailable. All of these benefits are feasible when soil has adequate pore space, which is only possible when soil’s natural physical texture and structure have been preserved or created.

Over-compaction of soils is one of the greatest deterrents to implementing best practices for stormwater management, because crushed particles minimize pore space and prevent water and air from moving through. In a study by the University of Florida, soil compaction from construction vehicles reduced infiltration by 70 to 90% [2].  This is perilously close to impermeable pavement.While people recognize that reducing pavement is the primary way to improve stormwater management, few see the same connection with soil. It is not enough to substitute pavement with plant beds if nothing has been done to prevent construction compaction. Without a soil management plan that includes practices for dealing with compaction before, during, and after development, urban soils will continue to become, plot by plot, a decommissioned resource in stormwater management.


A Partnership between Urban Soils and Vegetation

The greatest positive effect of healthy urban soil is most evident in plants, the workhorses of the environment that clean the air, absorb CO2, abate high temperatures, support wildlife, slow stormwater runoff, and keep erosion in check. In recent years, there has been resurgence in support for increasing the vegetation and tree cover in American cities. We are well aware of the positive ecological, social,[3]  and economic value of plants for individual properties, community open space, and urban regions [4]. Ecologically, a single large tree in the city is said to be ten to twenty times more beneficial to the environment than a single tree in the forest [5]. Yet the health of urban trees is declining at a rapid rate. A recent study by the U.S. Forest Service looked at twenty cities and found that they are losing tree canopy cover on average by 3% per year [6]. While this loss may seem small, over time the cumulative effects are severe. For example, Washington, D.C. lost 64% of its acreage-coverage from 1973 to 1999 at an average annual rate of 2.5% [7]. Still we continue to ignore the most basic need of trees: healthy soils. On most urban sites, fertile topsoil is absent, plant roots are restricted, air and water movement is suppressed, and nutrients cannot be exchanged. All this puts plants at an extreme disadvantage. The evidence of poor soil is all around, telegraphed by unhealthy plants. So if trees are to become “beautiful utilities” as urban tree expert Henry Arnold [8] suggests, then soil must also be treated in projects as an essential utility: analyzed, engineered, budgeted, scrutinized, and maintained.

Boston Children's Museum willow pit_MVVA

The existing seawall at the Boston Children’s Museum let salt water inundate natural soils, rendering planting impossible. Custom waterproof plant boxes made from sheets of landfill liners hold new soil, sealing it from the Fort Point Channel waters. Photo by MVVA

Advocating for Soil

There are sound economic reasons to invest in good soil. As one of the core infrastructural materials in every urban landscape project, soil needs only to be tended more carefully to make it a viable component of stormwater management. Using soils to store and retain water as part of the stormwater management system can reduce costs for piping, drainage structures, runoff storage tanks, irrigation systems, and infrastructure maintenance and can provide more flexibility in design, since hard systems can add horizontal and vertical complexity that limits design options. Plants (especially street trees) with well-functioning soil are more able to start and sustain the nutrient cycling system without big infusions of maintenance after establishment and in maturity. When they do get maintenance, they are more likely to respond. Healthy soils beget trees that live longer and grow bigger, enabling them to cast more shade, and absorb more CO2, and runoff. Even asphalt benefits from healthy trees, since shade improves its performance and durability [8]. Last, trees in good quality soil are far less prone to infection and pests, virtually eliminating the need for chemical treatments [9]. Investing in soil is critical for the long-term health of urban trees and by extension for the success of sustainable landscape projects and green infrastructure programs.

Why then do urban soils get so little attention when they are such a critical part of our environmental infrastructure and, ultimately, of human well-being? Some of the unawareness stems from societal and governmental ignorance. While keeping water and air usable is an unquestioned necessity, few people have the same association with city soils. For the most part, urban soil is considered mysterious, complex, and costly. Design professionals have an important role to play in dispelling unwarranted concerns and helping solve tangible problems: They should lead the way, project by project, educating their clients, agencies, and others about the need for healthy soil. Before that happens, designers must step up their own soil education. My interactions with colleagues suggest a dearth of understanding of basic soil science and the need for soil management in landscape projects. Often other landscape architects reach out for soil advice only when something has gone wrong. Designers do however have a thirst for this information as is shown by the increasing number of packed sessions in soil education at the annual meeting of the American Society of Landscape Architects (ASLA), the professions’ largest organization. Perhaps the neglect is also due to the fact that soil is not yet a hip topic; it has no visual presence. For many, design attention is reserved for visual effects; the hidden, infrastructural elements of landscape have long been considered the domain of engineers and scientists.

In my work as a landscape architect at Michael Van Valkenburgh Associates, soil discussions begin early, sometimes in the concept phase and always by schematic design. Soil is always an item on the design checklist. Just as all practitioners request surveys to locate utility lines, we request USDA soil tests to understand what we have to work with. Partnering with soil scientists, we have learned to interpret laboratory tests so we can ask the right questions and frame discussions. We keep up with developments in soil science (biology is the big topic now), often consult allied professionals, incorporate quality control practices into our specifications, and closely monitor sourcing, blending, and installing of soils during construction. We consider soil rigorously, as we do any other product or system in our projects.

I don’t mean to imply that assuring good soil is obvious or easy; it is neither, even for a firm that has been attempting it for twenty years. Every project brings unique soil challenges and clients with different agendas. The client may be unfamiliar with non-traditional stormwater approaches and therefore reluctant to consider soil-dependent systems. Brownfield properties often have contaminated soil or no useful soil at all. In other kinds of properties, existing soils could be reused if amended, but space may be too limited to manage soil-blending operations. Sometimes soil chemistry is limiting. For example: elevated pH from concrete or limestone rubble can interrupt nutrient exchange and narrow plant selection; high salinity in soil near tidal waters wreaks havoc on water uptake and cellular structure in plants. Local contractors often have no experience with installing designed soils. In my experience, construction managers show little tolerance for any aspect of landscape construction that is dynamic, an inherent characteristic of soil in particular and landscapes in general. Unless we have a repeat client, the process of educating, convincing, and making monetary tradeoffs to get good soil starts anew on every project. Sometimes we battle the sins of others’ projects in which someone tried but failed to improve soils. Projects with unsuccessful or difficult soil processes often produce rumors that the landscape architect specified unrealistic soils that cost too much and slowed the schedule, even if the problem was caused by the laxity of a member outside the design team.

Boston Children's Museum_MVVA

Shown here in 2012, the subsurface box planters at Boston’s Children’s Museum hold willow trees installed in 2006.  Photo by Elizabeth Felicella.

Repositioning Soil as Infrastructure

How can we begin a campaign for good urban soil? We can start by talking with city hall, one of the biggest makers of landscapes and planters of trees, about the importance of soil. How many of the thousands of landscapes planted every year include soil improvement? Atlanta, Detroit, Denver, Los Angeles, and many other cities have tree-planting programs. Ambitious past and current mayors like Richard Daley and Michael Bloomberg launched campaigns to plant a million trees. Despite current commitments to increasing urban vegetation through tree planting, under current practices the mortality rate for young street trees is shockingly high: Some studies have found that over twenty-five percent of newly planted trees die within two years of installation [10,11], wasting already strained public funds and leaving behind a depressing reminder of failed nature. Wouldn’t it be more strategic to forgo planning one million trees in poor soil and instead plant 500,000 trees in good soil? [12]

To be stewards of urban soils, we need to ask pointed questions early in and throughout projects and insist on satisfactory answers that ensure positive long-term results for stormwater and planting. When zoning requires developers to add or replace trees, we need to ask for more than in-kind caliper inches and to require a soil management plan. When contractors install soil, they need to treat it like the valuable commodity it is or bear the cost of remediation. State and municipal specifications (which are used by contractors defensively instead of proactively) already define which dirt is suitable for backfill—why not extend this thinking to include requirements for the type, procurement, handling, and installation of planting soil? Landscape architects and anyone else who works with the landscape need to heed these too. Such guidelines should not be overly technical or onerous. Plant species should be matched to soil conditions, especially its pH and water supply. Trees should be planted at the right elevation to expose the root flare so soil doesn’t suffocate the tree. Adequate soil volume (800 to 1400 cubic feet per tree) and shared root space to encourage root spread should be provided [13]. Soils should be arranged to mimic the horizons in nature in which the top is rich in nutrients, the middle has the correct structure to encourage root growth, and the bottom is drainable. To resist compaction and maintain water and air exchange, soils higher in medium-to-coarse sands (rather than easily compactable fine sands and loam) should be used, and limits on density should then be set. Wet or frozen soils should not be moved or installed. To promote water and air exchange, rootball zones in tree pits should be exposed and at least half of the surface area of a plant bed should be left open, or a simple aeration system should be installed. Well-aged compost should be used to to provide 5% to 10% organics to the top layer of soils. And last, utilities should be placed at least three feet from trees.

There are more technical elements and specifications to consider, especially for sites with no soils, but as Stuart Shillaber the superintendent of horticulture at Boston’s Rose Fitzgerald Kennedy Greenway Conservancy advised me recently about introducing organic maintenance, “be happy when someone can implement 60% of the program. The rest will come when clients see results.

The installation and upkeep of our existing “hard” utility systems requires substantial public and private investment. Creating well-functioning soils would not require large funds from the public since this work can be achieved project by project.  Upkeep of hard utilities is costly and disruptive; not so for soils that can be tended several times a year with substantially less trouble. The ASLA estimates that every year nearly 4.6 million acres are affected by public and private landscape projects [14]. Making headway on a quarter to third of that amount would start a revolution.


The Future of Urban Soils

From my vantage point, prospects for improving urban soils are good. In my thirty-year career as a landscape architect, there has never been a time of greater interest, research, and resources for managing urban soils and as many successfully constructed projects using urban soils. Advocacy for higher quality soil is rising nearly forty years after Dr. Phil Craul (professor emeritus at SUNY) and his colleagues started the field studies on urban soils that led to his 1992 publishing of the seminal Urban Soil in Landscape Design. Today, the USDA’s National Resources Conservation Service has substantial mapping, literature, and research on urban soils [15]. Ted Hartsig, a division chair of the Soil Science Society of America, tells me that the organization recently formed an urban soils division and committee whose focus is issues of urban soils including morphology and classification, the relationship of chemicals and nutrient quality, physics, biology, and structure, as well as the restoration and management of these soils. Urban soils studies are proliferating at public and private universities like Johns Hopkins and Kansas State.

Most critically, the public is starting to understand at the personal level of their gardens that the old adage “better to put a $5 tree in a $50 hole than to put a $50 tree in a $5 hole” is correct. Remember that until professionals and individuals teamed together to demand action, climate change was downplayed. Landscape architects and other professionals must play a part, whether through projects, lobbying our government, writing articles, lecturing, self-education, or speaking up in any propitious situation. We can be plausible leaders in the discussion to invest in another underworld utility, the first that is purely for the public good.


Solano_bio pic_144Laura Solano is a Principal at Michael Van Valkenburgh Associates in Cambridge, MA and an Adjunct Associate Professor at Harvard University’s Graduate School of Design.  In practice for over 30 years, Laura has been an integral contributor to many of MVVA’s best-known landscapes, including: Teardrop Park, Restoration of Pennsylvania Avenue in front of the White House, the George W. Bush Presidential Center, Boston Children’s Museum Entry Plaza, and Don River Park in Toronto. She lectures across the US on technology, was on the Soils Committee for the Sustainable Sites Initiative, is featured in the film “Leaders in the Field: Women in Landscape Architecture”, and is a board member of the Landscape Architecture Foundation.


References

[1]  Soil Quality Information Sheet. Soil Quality Indicators: Infiltration”, Natural Resources Conservation Service, USDA, January 1998 http://www.nrcs.usda.gov/Internet/FSE_DOCUMENTS/nrcs143_019144.pdf
[2]  J.H. Gregory, M.D. Dukes, P.H. Jones, and G.L. Miller, “Effects of urban soil compaction on infiltration rate,” Journal of Soil and Water Conservation, Volume 61, Number 3. http://abe.ufl.edu/mdukes/pdf/stormwater/Gregor-et-%20al-JSWC-compaction-article.pdf
[3]  Geoffrey H. Donovan, David T. Butry, Yvonne L. Michael, ScD, Jeffrey P. Prestemon, Andrew M. Liebhold, Demetrios Gatziolis, Megan Y. Mao, American Journal of Preventive Medicine, “The Relationship Between Trees and Human Health: Evidence from the Spread of the Emerald Ash Borer,” Volume 44, Issue 2, pp. 139–45, http://www.ajpmonline.org/webfiles/images/journals/amepre/AMEPRE_3662-stamped_Jan_8.pdf
[4]  “Statistics on the Economic Value of Trees,” Conservation Montgomery, http://conservationmontgomery.org/resources2.html
[5]  “Study: Nations urban forests losing ground; New Orleans, Albuquerque, Houston losing Trees.” News Release, USDA Forest Service, February 23, 2012, http://www.fs.fed.us/news/2012/releases/02/urban-forests.shtml
[6]  Stephen C. Fehr, “Mayor Working To Keep It Green; Williams Pleads For More Trees,” Washington Post, November 17, 1999, http://caseytrees.org/wp-content/uploads/2012/02/02.01.1999-original-article-washingtonpost.pdf
[7]  Henry Arnold, “Sustainable Trees for Sustainable Cities,” Arnoldia, Volume 53, Number 3, 1993, http://arnoldia.arboretum.harvard.edu/pdf/articles/1993-53-3-sustainable-trees-for-sustainable-cities.pdf
[8]  E. Gregory McPherson and Jules Muchnick, “Effects of Street Tree Shade on Asphalt Concrete Pavement Performance,” Journal of Arboriculture, Volume 31, Number 6, November 2005, 303, http://www.fs.fed.us/psw/publications/mcpherson/psw_2005_mcpherson001_joa_1105.pdf
[9]  “Basics of Organic Maintenance”, UMass Extension, Center for Agriculture, http://www.extension.org/pages/62978/basics-of-organic-landscape-maintenance
[10]  “New Research Survey Suggests Urban Trees are On the Decline,” Public Radio International, March 16, 2012, http://www.pri.org/stories/science/environment/new-research-survey-suggests-urban-trees-are-on-the-decline-8967.html
[11]  Jacqueline W.T. Lu, Erika S. Svendsen,
Lindsay K. Campbell, Jennifer Greenfeld, Jessie Braden, Kristen L. King, and Nancy Falxa-Raymond, “Biological, Social, and Urban Design Factors Affecting Young Street Tree Mortality in New York City,” City and the Environment, Volume 3, Issue 1, 2010, http://digitalcommons.lmu.edu/cgi/viewcontent.cgi?article=1069&context=cate
[12]  “As City Plants Trees, Some Say a Million Are Too Many,” The New York Times, October 18, 2011, http://www.nytimes.com/2011/10/19/nyregion/new-york-planting-a-million-treestoo-many-some-say.html?pagewanted=all
[13]  James Urban, Up by Roots: Healthy Soils and Trees in the Built Environment, International Society of Arboriculture, 2008
[14]  “What is Landscape Architecture?” American Society for Landscape Architects, http://www.asla.org/nonmembers/LicPac99.htm
[15]  Soil Quality Information Sheets, Soil Quality Institute in cooperation with the National Soil Survey Center, NRCS, USDA; and the National Soil Tilth Laboratory, Agricultural Research Service, USDA, http://soils.usda.gov/sqi/publications/publications.html#utn


Suggested Reading

Timothy A. and Philip J. Craul, Soil Design Protocols for Landscape Architects and Contractors, Jon Wiley & Sons, 2006.
James Urban, Up by Roots: Healthy Soils and Trees in the Built Environment, International Society of Arboriculture, 2008
“Standards for Organic Land Care, Practices for the Design and Maintenance of Ecological Landscapes”, NOFA Organic Land Care Program publication, Northeast Organic Farmer’s Association, 2011. http://www.organiclandcare.net/sites/default/files/upload/standards2011.pdf
“Landscape Performance Series: Benefits Toolkit, Fast Facts Library, Scholarly Works”, Landscape Architecture Foundation, http://lafoundation.org/research/landscape-performance-series/